Every Wednesday at 9 AM, your finance team begins the ritual.
Export from Stripe. Paste into Excel. Copy to Salesforce. Update the dashboard. By noon, three people have touched the same numbers four times. None of this is in anyone’s job description.
When you hired a Head of Finance, you didn’t write “data translator” in the role description. Yet that’s what 60% of their time has become—not analysis, not strategy, just translating between systems that can’t speak the same language. Your finance team isn’t working with money anymore. They’re working with the architecture of your software stack.
This Wednesday morning ritual happens in every department. Operations copies inventory data from your warehouse system to your fulfillment platform. Customer success manually syncs account health scores from your product analytics into your CRM. Your project managers update timelines in three different places because each stakeholder uses a different tool.
The pattern is universal: businesses don’t lack data—they drown in the work of moving it between disconnected islands.
The Copy-Paste Economy: How Operations Teams Became Data Translators
If this feels familiar, you’re not experiencing a unique failure. You’re experiencing the architecture of modern business software.
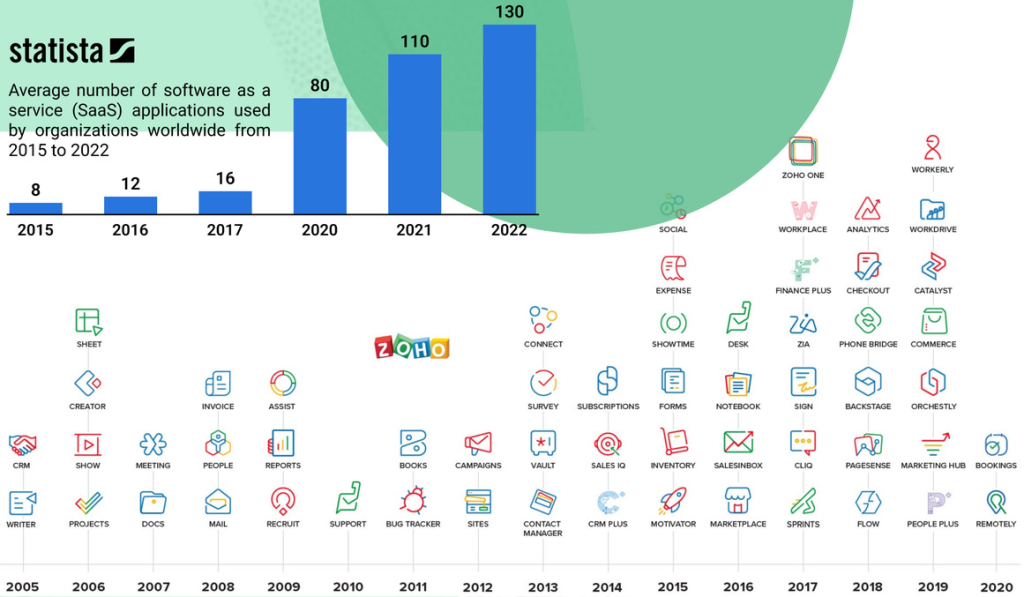
The average mid-market company now uses 137 different applications, according to Okta’s 2024 “Businesses at Work” report. That’s not the problem. The problem is that each of those 137 systems defines the same business entities differently. “Customer” means one thing in your CRM, something slightly different in your support platform, and something else entirely in your billing system.
Your operations team doesn’t spend their time translating data because they’re inefficient. They translate data because your systems speak 137 different languages.
Research from Harvard Business Review found that knowledge workers switch between applications and websites nearly 1,200 times per day. These aren't just app switches—they're cognitive context switches. Every time someone moves from your CRM to your project management tool to your finance system, they're not just switching screens. They're switching data models, switching object definitions, switching mental maps of how information connects.The University of California, Irvine studied this phenomenon and found it takes an average of 23 minutes and 15 seconds to fully regain focus after a significant interruption. Even brief switches—the kind that seem harmless—accumulate into hours of lost productive time. According to research compiled by Qatalog, context switching could be draining up to 40% of productivity every single day.Scale that across millions of workers, and you arrive at Gallup’s estimate: context switching costs the US economy approximately $450 billion annually in lost productivity.
But the real cost isn’t measured in billions. It’s measured in Wednesday mornings. In the ritual of copying data that should flow automatically. In the operational work that exists only because your systems don’t share a common foundation.
This Isn’t a Training Problem—It’s an Architecture Problem
The conventional explanation for this waste goes something like: “Our team just needs better processes. We should standardize our data entry. We need more discipline around keeping systems updated.”
That explanation misses the point. The inefficiency isn’t a people problem. It’s a fundamental architectural mismatch.
Consider what happens when you add a new customer to your business:
- Your CRM creates a Customer record with fields for Company Name, Industry, Annual Revenue, Contact Person, and Deal Stage. The CRM’s data model assumes customers are always companies pursuing deals.
- Your support platform creates a different Customer record with fields for Email, Support Tier, Ticket History, and CSAT Score. The support system’s data model assumes customers are people who need help.
- Your billing system creates yet another Customer record with fields for Payment Method, Billing Cycle, MRR, and Account Status. The billing model assumes customers are financial relationships.
Same customer. Three different definitions. Three different data structures. Three separate databases that require manual synchronization or complex integration code to stay aligned.
This isn’t about discipline. You can’t discipline your way out of schema fragmentation. When every system defines “customer” differently at the database level, translation work becomes structurally necessary.
Research from MuleSoft's 2025 Connectivity Benchmark Report reveals that only 28% of enterprise applications are actually integrated. The average organization runs 897 applications, and 95% of IT leaders report that integration issues actively impede their AI implementation efforts.That last statistic matters. The promise of AI-driven business intelligence depends entirely on unified, clean data. But when your data lives in 137 different structures across disconnected systems, you don’t have data—you have fragments. AI can’t fix fragmented architecture. It requires architectural unification as a prerequisite.
The Hidden Tax: What Schema Fragmentation Actually Costs
Let’s make the invisible visible. Here’s what schema fragmentation—the technical term for “every system defines things differently”—actually costs your organization:
1. Engineering Resource Drain
Gartner’s 2024 analysis found that companies spend 30-40% of their engineering resources maintaining integrations between systems. Not building new features. Not improving products. Not automating processes. Just keeping systems talking to each other.
Think about what that means. If you have a team of 10 engineers, 3-4 of them exist primarily to write and maintain the glue code between your disconnected tools. That’s $300K-$400K annually in salary alone, spent on work that creates no direct business value.
And it’s fragile work. Every time one of your 137 applications updates its API or changes its data structure, those integrations break. According to Informatica’s 2024 report, 79% of organizations have undocumented data pipelines, and 57% report that business needs change before integration requests are even fulfilled.
The average data pipeline takes up to 12 weeks to develop. By the time it’s ready, the business requirements have often moved on.
2. Decision Latency
Forrester’s 2024 Operations Survey found that the average delay between when data updates in one system and when it appears in another ranges from 4 to 48 hours in 73% of organizations.
That lag matters more than it sounds. When your sales team closes a deal on Monday but your support team doesn’t see the new customer record until Wednesday, they can’t provide informed service. When your finance team is working off yesterday’s revenue numbers to make today’s hiring decisions, they’re making strategic choices with stale information.
This isn’t about wanting real-time dashboards for the sake of pretty visualizations. It’s about the compound effect of systematic delay. Every decision made on outdated information is a decision made in the dark.
3. Cognitive Load and Mental Fragmentation
The productivity loss from context switching isn’t just about time. It’s about the mental cost of maintaining multiple data models simultaneously.
When your operations manager needs to understand how a project is progressing, they have to:
- Check the project management tool for task completion
- Switch to the CRM to see customer communications
- Jump to the finance system to verify budget status
- Open the time tracking tool to see resource allocation
- Pull up Slack to find the latest team discussion
Each switch requires them to remember: “In this system, projects are organized by client. In that system, they’re organized by team. In this other system, they’re organized by budget code.” They’re not just switching tools—they’re switching mental models of how the business is structured.
Research from Carnegie Mellon shows that even brief interruptions can increase task completion time by up to 23%. For complex cognitive work like operations management, the cost multiplies. When you’re juggling five different mental models, you’re not working at 80% capacity. You’re working at 40% capacity while feeling like you’re working at 120%.
4. The Invisible Work Multiplier
The most insidious cost is the work that exists only because of fragmentation—work so normalized it’s become invisible.
- Weekly reconciliation meetings to align data between systems
- Manual export/import cycles to keep information synchronized
- Dedicated roles (“Salesforce admin,” “integration specialist”) that exist solely to manage system boundaries
- Training overhead teaching new hires six different interfaces for what’s conceptually the same information
- Audit trails scattered across multiple systems when compliance requires unified documentation
A 2024 Intuit QuickBooks survey found that businesses spend an average of 25 hours per week reconciling data across applications—that’s 1,300 hours annually. At an average fully-loaded cost of $75/hour for knowledge workers, that’s nearly $100,000 per year in reconciliation work alone.
And that’s just the measurable overhead. The unmeasurable cost is in the questions that never get asked, the analyses that never get run, the insights that never surface—because pulling the data would require touching eight different systems.
Why Integration Doesn’t Solve Fragmentation
The conventional solution to this problem is integration. Build APIs. Use middleware platforms. Connect everything. Make the data flow automatically.
Integration helps. Automated data sync is better than manual copy-paste. But integration doesn’t eliminate the fundamental problem—it just automates the translation layer.
Here’s why:
Integration maintains separate schemas. Your CRM still defines “customer” one way, your support platform defines it another way, and your billing system defines it a third way. The integration code translates between them, but the underlying fragmentation remains.
Integration creates coupling without unification. When System A updates its data model, the integration to System B breaks. When you add a new field to your customer definition, you need to update not just the CRM, but also every integration that touches customer data. The complexity grows exponentially with each new connection.
According to research from Future Processing, poor data quality—the kind of inconsistencies that arise from maintaining separate schemas—demands extensive data cleansing and validation before accurate integration can even occur. The hidden costs of data quality issues substantially impact integration project budgets by introducing extra layers of work and complexity.
Integration platforms themselves become another layer. Tools like Zapier, MuleSoft, or custom-built middleware add their own complexity, their own failure modes, their own maintenance overhead. You’ve replaced the problem of disconnected systems with the problem of managing the system that connects the disconnected systems.
A revealing statistic from IT Convergence: when organizations attempt to centralize fragmented data, they frequently discover that different departments have been maintaining conflicting versions of the same information. The process of reconciling those conflicts—deciding which “customer” definition is authoritative—becomes a political and organizational challenge, not just a technical one.
The root problem isn’t that systems don’t talk to each other. It’s that they don’t share a common foundation.
The Alternative: Unified Architecture from First Principles
What would it look like if your business systems started from a shared foundation instead of bolting together separate applications?
Instead of:
- A CRM with its customer definition
- A support platform with its customer definition
- A billing system with its customer definition
- Integration code to synchronize the three
You’d have:
- One customer object
- Different views and workflows for sales, support, and billing
- No synchronization needed because there’s only one source of truth
This isn’t a theoretical concept. It’s architectural unification—the principle that instead of building separate systems and connecting them, you build from a common foundation.
Think about the smartphone convergence moment. Before the iPhone, you carried separate devices: a phone, a camera, an MP3 player, a GPS navigator, a calculator, a watch. Each device had its own battery, its own interface, its own learning curve. You managed the boundaries between them (“remember to sync your photos to your computer”).
The smartphone didn’t just integrate those devices. It unified them on a common platform. Now when you take a photo, you don’t think about “syncing the camera to the storage system.” The photo lives in one place, accessible to any app that needs it. The calendar app can geo-tag events because location and time share the same foundation.
That’s the difference between integration and unification.
Luklak’s approach uses what we call Universal Objects—a flexible data foundation that every business function shares. When you create a “customer” object, it’s the same object whether you’re viewing it in a sales pipeline, a support ticket, or a billing dashboard. Not three copies kept in sync. One object, many views.
When Blue Media, a Vietnamese marketing agency, consolidated their operations onto this kind of unified foundation, they eliminated what they describe as “the Wednesday morning ritual.” Their finance team stopped translating data between systems because there was nothing to translate. The agency’s project data, customer records, and financial information all sat on the same architectural foundation.
The time savings were immediate and obvious. But the strategic advantages took longer to recognize. When everything shares a foundation, questions that were previously complex become simple. “Which customers are most profitable?” used to require pulling data from three systems, reconciling IDs, and hoping nothing was out of sync. Now it’s a single query. “What’s the relationship between project scope changes and customer satisfaction?” used to be unanswerable because the data lived in separate universes. Now the relationship is native.
Calculating Your Organization’s Fragmentation Cost
You can measure your own fragmentation tax with surprising precision. Here’s a framework:
Step 1: Count Your Systems
List every business application your organization uses that stores operational data. Not just the big ones—include the spreadsheets teams maintain because “the official system doesn’t quite work for us.”
Most mid-market companies discover they’re using 80-150 applications.
Step 2: Identify Overlap
For each major business entity (Customer, Project, Employee, Asset, Transaction, etc.), count how many systems define it. Draw the connections where data needs to sync.
If you have three systems that define “customer,” you have three data translation problems.
Step 3: Calculate Synchronization Hours
Estimate how much time your team spends:
- Manually moving data between systems (exports, imports, copy-paste)
- Reconciling discrepancies when systems disagree
- Fixing broken integrations
- Training new people on multiple interfaces
- Building reports that span multiple systems
Be honest. Most organizations underestimate this by 50-70%.
Formula:
(Weekly sync hours) × (Fully-loaded hourly cost) × 52 weeks = Annual synchronization cost
Step 4: Estimate Decision Latency Cost
Identify one significant decision your organization made in the last quarter based on data that was 24+ hours old. Ask: “If we had real-time data, would the decision have been different? What would better timing have been worth?”
Multiply that value by how many such decisions you make annually.
Step 5: Calculate Opportunity Cost
This is harder to quantify but often larger than direct costs. List analyses, dashboards, or insights you’d want but can’t build because the data is too fragmented. What would those capabilities be worth?
Common examples:
- Predictive churn models (require unified customer data across sales, support, usage)
- True project profitability (require time tracking, expenses, and revenue in one view)
- Resource optimization (require unified view of people, projects, and capacity)
The Path Forward
The fragmentation problem has three possible futures:
Path 1: Accept the cost. Continue with your current architecture. Accept that 30-40% of your operational capacity goes to translation work. Accept that your teams will spend Wednesday mornings moving data manually. Accept the cognitive load, the latency, the invisible work.
Many organizations implicitly choose this path. Not because they want fragmentation, but because the migration cost to fix it seems overwhelming.
Path 2: Integrate harder. Double down on integration platforms. Build more APIs. Hire more integration specialists. Automate the translation layer. Accept that you’re managing complexity rather than eliminating it, but at least reduce the manual burden.
This path helps. Automated sync is better than manual sync. But it doesn’t eliminate the architectural fragmentation—it just makes living with it more bearable.
Path 3: Rebuild on unified architecture. Start with operations that hurt the most. Consolidate them onto a shared foundation. Prove the value with one team, one function, one workflow. Then expand.
This is the hardest path in the short term. It requires rethinking how your systems are structured. It requires migration effort. It requires getting comfortable with platforms that are less mature than the enterprise behemoths.
But it’s the only path that eliminates the problem rather than managing it.
The Real Question
The question isn’t whether your organization experiences fragmentation. If you use more than a handful of business applications, you do.
The question is: What’s the fragmentation costing you?
Not in vague productivity terms, but in concrete, measurable terms. Hours spent on Wednesday morning rituals. Engineering resources consumed by integration maintenance. Decisions made on stale data. Questions that can't be answered because the data lives in separate universes.Calculate that cost honestly. Then ask whether that’s a price worth paying.
For Blue Media, the answer was clear. For your organization, the calculation might be different. The fragmentation tax might be an acceptable cost of doing business. The integration layer might be working well enough.
But you can’t make that decision without making the cost visible.
The $450 billion context switch isn’t an abstract statistic about the economy. It’s an aggregation of millions of Wednesday morning rituals. It’s real people doing work that shouldn’t need to exist. It’s operational capacity consumed by architectural choices made years ago.
The first step to solving it is seeing it.


