TL;DR: Slack discussions vanish into general channels. Critical decisions get buried in DMs. Unified Livechat attaches conversation directly to work objects—preserving context, decisions, and institutional memory where they matter.
“Why did we choose vendor B again?”
Nobody remembers. The conversation happened somewhere in Slack, six months ago, buried between 4,000 other messages. Your brain knows the decision was made. The reasoning? Gone.
The Divorce of Talk and Work
We have accepted a bizarre architecture for modern work:
The Work lives in structured databases (CRM, Project Tools, ERP).
The Talk lives in ephemeral streams (Slack, Teams, Email).
This separation imposes a “Context Tax” on every employee.
When you see a task labeled “URGENT” in your project tool, you don’t know why it’s urgent. You have to switch to Slack to find the context. When you see a deal stage move to “Negotiation” in your CRM, you don’t know what the blockers are. You have to email the rep to ask.
Your team spends half their day simply bridging the gap between where the data sits and where the decisions happen.
When talk is temporary—detached from the work it concerns—your organization pays four hidden taxes.
The Four Hidden Taxes of Temporary Communication
The Toggling Tax. Knowledge workers switch between applications 1,200 times per day, spending 9.5% of their time navigating between tools. But the real cost isn’t the switching—it’s context reconstruction. Every jump from Slack to your project tool requires rebuilding mental context. Which project were we discussing? What was decided? Your brain burns energy translating between systems.
“I Didn’t Say So.” Important decisions happen in general channels. Six months later, nobody remembers why the pricing changed—only that it changed. Someone asks, “Why did we choose vendor B?” The conversation is buried somewhere in #general between 4,000 other messages. Institutional memory evaporates because decisions aren’t attached to the work they affect.
“I Didn’t Know.” Real work happens in DMs. The critical debate about scope change? Private thread between two people. Leaders see the “Done” status but miss the trade-offs that led there. The system records outcomes, not reasoning. When decisions live in side channels, organizational intelligence degrades.
“It’s a Matrix.” New team members inherit current status but lack history. They waste months relearning lessons the team already solved—because context is locked in closed Slack channels and departed employees’ message archives. Onboarding becomes archaeological excavation instead of knowledge transfer.
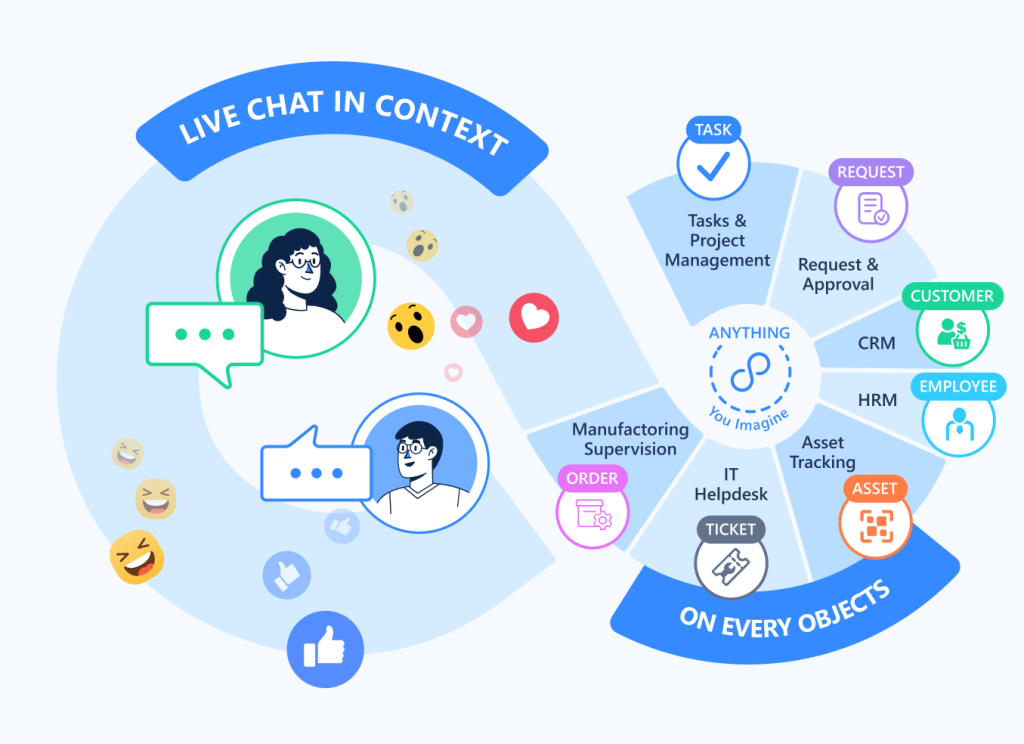
Conversation as Permanent Record
Unified Livechat inverts the model. Instead of treating communication as temporary—something that happens in channels and then disappears into scroll-back—conversation becomes part of the permanent work record.
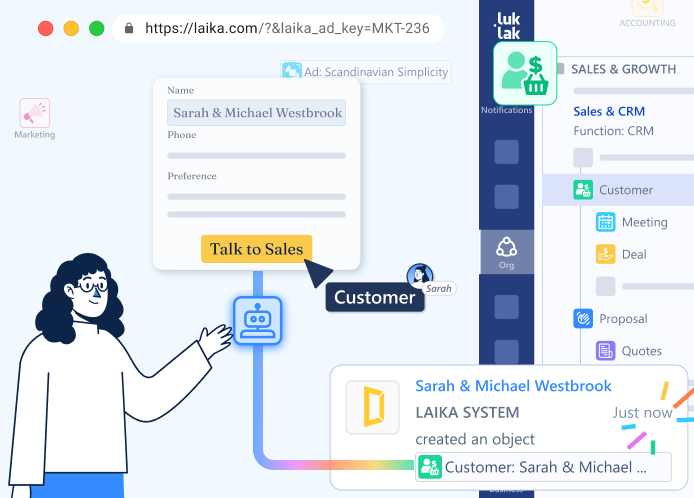
Open a customer record. The discussion thread lives there—every conversation about this customer, visible to anyone with access. Open a project. The project chat appears—every decision, every question, every status update, permanently attached.
The work and its conversation history occupy the same space.
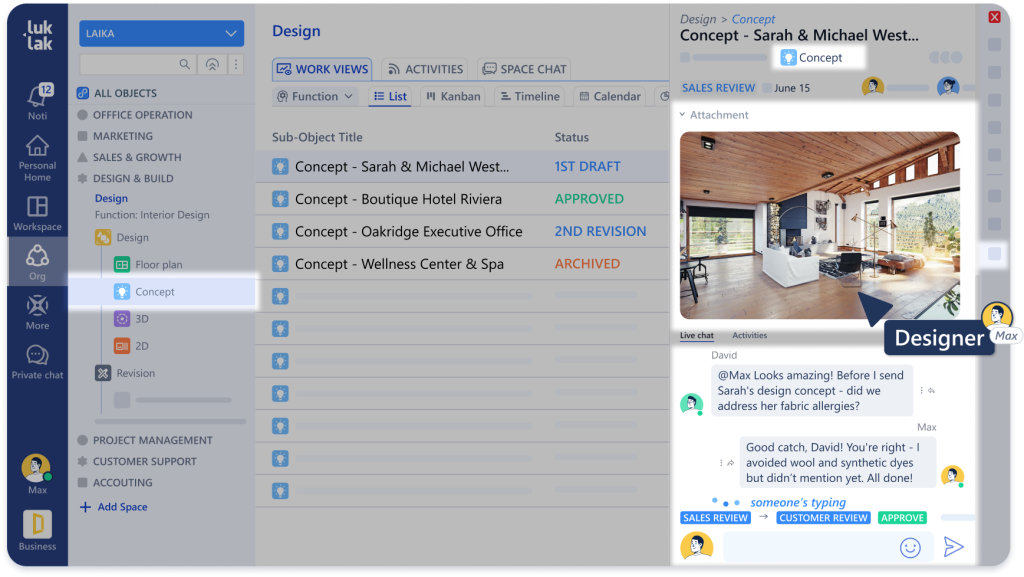
At LAIKA, this transformed how institutional memory works. When someone asks about the Miley Construction project, they open the project object. The entire discussion history is there: initial scope conversation, the debate about material choices, the decision to extend timeline, the client feedback on design drafts.
Six months later, a similar project starts. The team opens the Miley project, reads the chat history, and learns from decisions already made. Organizational intelligence compounds instead of resetting.
How Permanent Context Works
Every Universal Object—customer, project, task, invoice, support ticket—includes native conversation threading:
Thread per object. Each work object maintains its own discussion history. Customer #4132 has its conversation record. Project #826 has separate discussion. Context stays attached to the work it concerns.
Visibility by permission. See the customer object? You see its conversation history. Permission inheritance is automatic. No separate channel management.
Automatic context inheritance. Open a task within a project. You can see both task-level discussion and parent project and the customer connected. Understanding flows above and beyond your silos.
Rich work artifacts. Share files directly in object conversation. They attach to the object permanently. Create task assignments without leaving the discussion. Mention users with @-notifications that link directly to the work item.
Decision archaeology becomes instant. Six months later, someone asks, “Why did we choose this approach?” Open the project. Scroll the conversation thread. The discussion where that decision happened appears—complete with the rationale, alternatives considered, and trade-offs accepted.
The Intelligence of Visibility
When conversation attaches to work objects, collective intelligence becomes visible across the organization.
LAIKA discovered their most successful projects shared a pattern: sustained conversation density throughout execution. Projects with regular discussion—questions asked, decisions debated, trade-offs discussed—delivered better outcomes than projects with sparse communication.
They couldn’t have seen this when conversations happened in Slack. The pattern only emerged when discussion history lived on project objects, visible to anyone analyzing project performance.
Similar discoveries:
Support tickets with extended discussion threads resolve faster—because context stays attached, reducing repetitive question loops
Projects with conversation gaps (weeks of silence) correlate with missed deadlines—early warning becomes visible
Customer relationship depth (measured by conversation continuity) predicts renewal probability better than transaction volume
This collective intelligence emerges because conversation becomes structured organizational memory, not ephemeral messaging.
Multimodal Context
Unified Livechat doesn’t just capture text. It becomes the medium for all object-related communication:
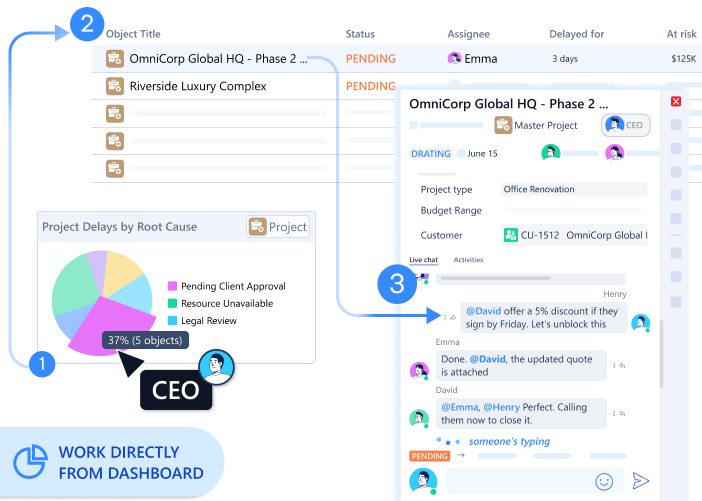
File context. Share a design mockup in project chat. It attaches to the project automatically. Six months later, someone asks, “What was our initial concept?” Open the project. Scroll the chat. The file is there.
Decision history. “Why did we choose vendor B?” Search project chat. The conversation where that decision happened appears—complete with the comparison table someone pasted in.
Status narrative. Watch a project’s chat thread over time. It’s a complete narrative of how the work evolved—who blocked whom, where assumptions changed, when scope crept.
Traditional tools separate communication from artifacts. You discuss in Slack, store files in Drive, track work in Asana. When you need context, you’re reconstructing across three systems.
With embedded chat, the context is atomic. The conversation and the work are one unit.
What Disappears
Several rituals common to fragmented tools simply vanish:
Status update meetings. When conversation lives on work objects, everyone with access sees the discussion history. The project’s current state is documented in its thread. Status meetings become decision meetings, not information-transfer sessions.
“Where did we discuss this?” The discussion is permanently attached to the work item it concerns. No searching Slack channels or email folders.
Onboarding context gaps. New team member joins a project. They read the project conversation history. Two hours later, they understand past decisions, current blockers, and reasoning behind approaches. Institutional knowledge doesn’t evaporate when people leave—it’s preserved on the work objects themselves.
Cross-timezone coordination overhead. Remote teams use object conversation asynchronously. Paris discusses the project while Ho Chi Minh City sleeps. Morning team reads the thread. Context transfers perfectly without real-time overlap required.
The Architecture That Enables This
Unified Livechat works because it shares the Universal Object foundation. Conversation isn’t a separate feature—it’s part of the object architecture:
Same relationship graph. Conversation threads follow object connections. Customer conversation can reference related project discussion. Context links bidirectionally through the relationship network.
Same work visibility. Leaders see both project status AND the conversation that produced it. Decisions become visible, not just outcomes. Trade-offs get documented, not buried in DMs.
Permanent organizational memory. Conversations don’t disappear after 90 days (Slack’s free tier limit) or get archived into inaccessible storage. They live on work objects as long as the work exists.
Let’s welcome the marriage of work and chat
When conversation lives on work objects—not in temporary channels—institutional memory becomes architecturally preserved. Discuss the customer ON the customer. Discuss the project ON the project. Six months later, the reasoning is still there.
That’s Unified Livechat. Communication that builds organizational memory instead of losing it.
Next in the series: Universal Automation — How to automate across all your functions without writing integration code.
TL;DR: Traditional automation lives inside separate tools or costs $30 per 1,000 tasks through middleware. Luklak’s Universal Automation spans all your functions natively—because everything shares the same automation engine.
Your deal closes Friday afternoon. Monday morning, operations still hasn’t heard.
Not because sales forgot. The automation broke. Salesforce → Zapier → Asana failed silently over the weekend. Your team spent Monday doing manually what should have happened automatically.
The Automation Fragmentation Problem
Most business software handles automation in isolation.
Salesforce automates Salesforce. When deal closes, update fields, send notification, create task. Within the CRM only.
Asana automates Asana. When project status changes, move to next section, assign team member. Within project tool only.
Want cross-system automation? Pay for middleware. Zapier, Make, Workato—$300-3,000/month. Write integration logic. Debug when APIs change. Monitor for silent failures.
Engineering spends 30-40% of resources maintaining connections. Sync delays stretch to 4-48 hours. Workflows break when external APIs update. You’re not automating your business—you’re automating the gaps between disconnected systems.
One Automation Engine, All Functions
Universal Automation works differently. Because every function you build—CRM, projects, support, finance—uses the same Universal Object foundation, they share the same automation engine.
One rule spans sales, operations, finance, and support. No middleware. No integration APIs.
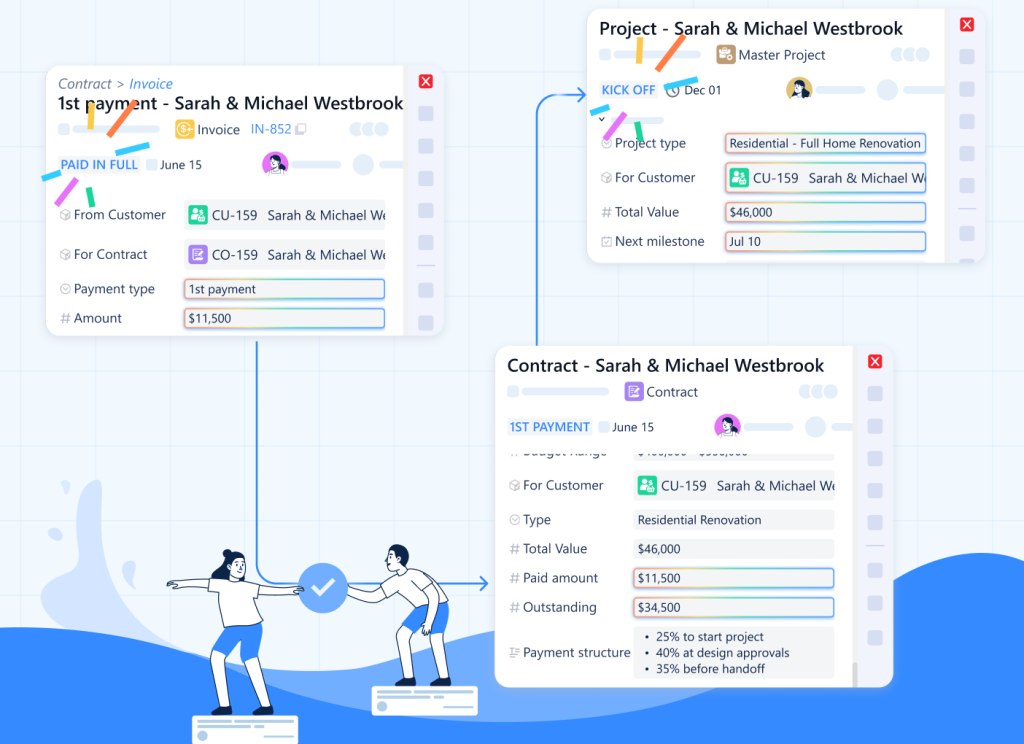
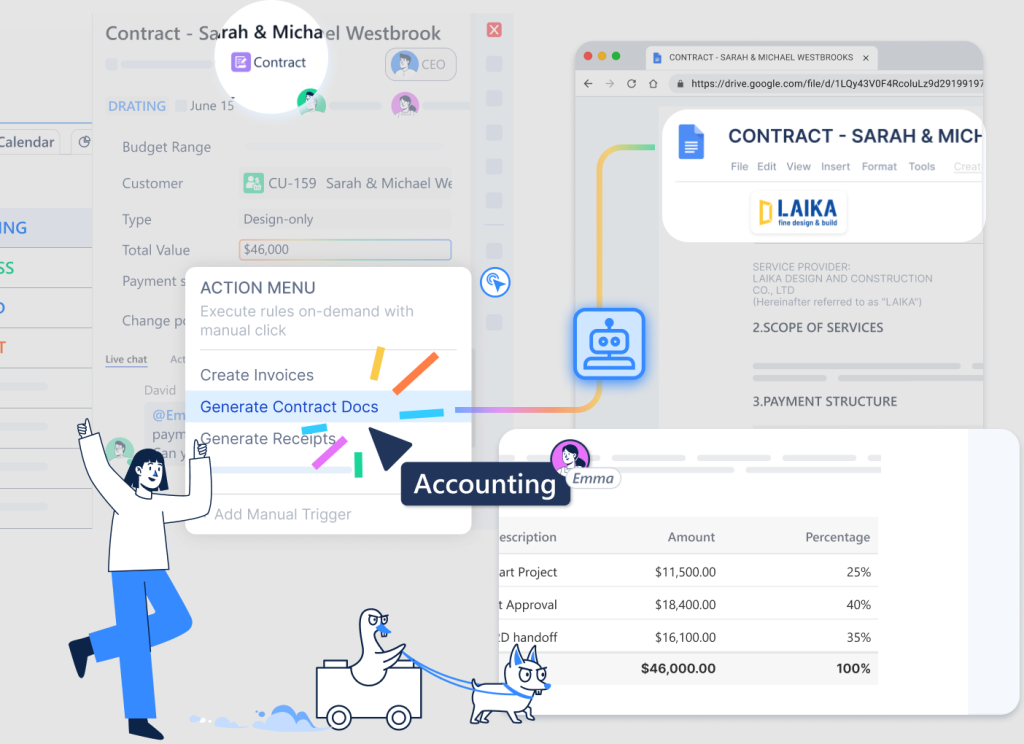
At LAIKA: When a deal reaches “Closed-Won”:
Create Project object (operations)
Assign based on deal type
Generate Contract object (legal)
Create first Invoice set to trigger at kickoff (finance)
Add Customer to quarterly review schedule (account management)
Send welcome email with portal access (client success)
Six functions. One automation rule. Zero integration code.
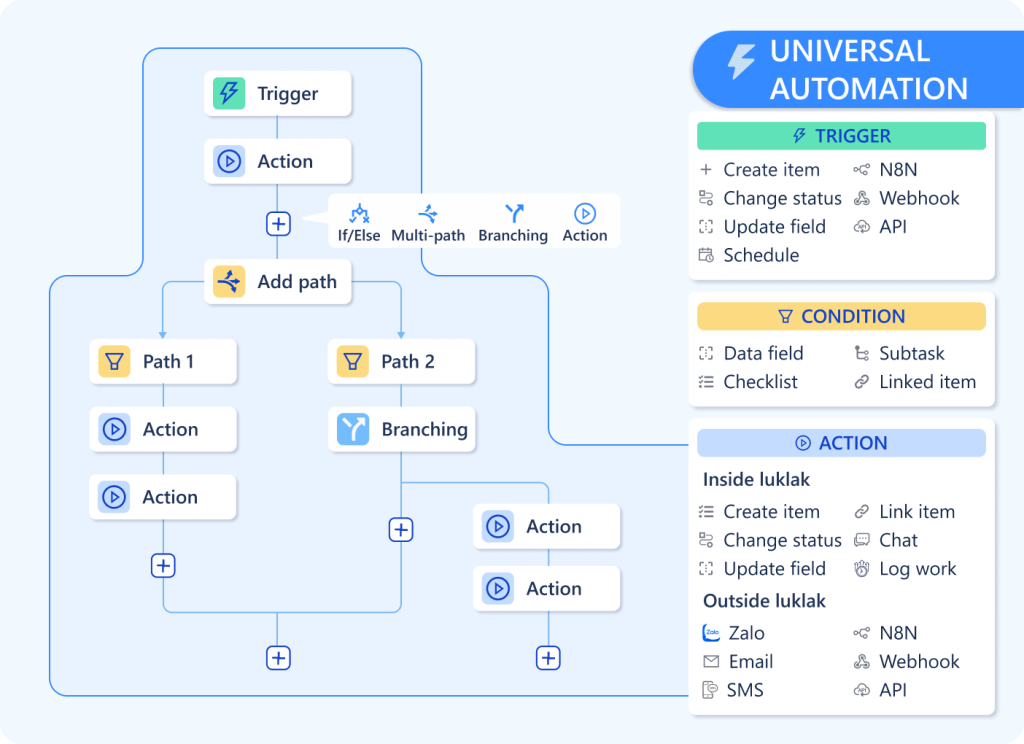
Cross-object checks: “If Customer Industry = ‘Construction’ AND Project Type = ‘Commercial'”
Actions (do these things):
Create new objects (with field mapping from trigger)
Update fields on current or related objects
Send chat messages and emails
Move objects through workflow stages
Assign to users or teams
Visual builder. Drag conditions. Map fields. Test immediately. No code required.
Cross-Functional Automation Without Integration
Native cross-object actions. One rule creates objects across multiple functions. Sales automation creates operations objects. Operations updates finance. Support escalates to engineering. No integration logic needed.
Bidirectional relationship traversal. Automation follows connections automatically. “When Task → Blocked, navigate to parent Project, update status to At Risk, navigate to Customer, notify Account Manager.” One rule. Four object types.
Bulk automation. “For all Projects where Status = In Progress AND Days Until Deadline < 7, send reminder to assignee and update Priority to Urgent.” Acts across hundreds of objects simultaneously.
Real Implementation: LAIKA’s Customer Lifecycle
LAIKA automated their entire customer journey with 12 automation rules:
Lead nurture: When Lead created, wait 2 days, check if Status = New, send follow-up, assign to next available rep using round-robin logic.
Deal progression: When Deal → Negotiation, create Contract draft, notify legal, pull template based on deal type, auto-populate details.
Project kickoff: When Deal → Closed-Won, create Project with phases based on service type, assign project manager by workload, create task list, send client welcome, schedule kickoff.
Milestone invoicing: When Project Phase → Complete, create Invoice for that phase, send to client, notify accounting, update revenue recognition.
Support escalation: When Ticket unresolved for >48 hours, escalate to senior support, notify account manager, create high-priority Task if technical.
Renewal tracking: 60 days before Contract end, create Renewal Opportunity, assign to account manager, pull health metrics, suggest pricing based on utilization.
Because automation shares the Universal Object foundation, it inherits object capabilities:
Learns from patterns. Track which automation rules trigger most frequently. “Deal → Closed-Won automation runs 47 times this quarter. Project creation happens automatically within 2 minutes. Zero manual handoffs.”
Exposes bottlenecks. “Invoice → Overdue automation triggered 23 times last month. 18 of them were for same customer. Payment terms need review.”
Measures impact. “Automated lead assignment reduced contact time from 4 days to 6 hours. Automated project creation eliminated 90 minutes of manual setup per deal.”
The automation engine doesn’t just execute rules. It provides visibility into automated operations.
When You Need to Reach Beyond
For everything inside Luklak—sales, operations, finance, support—you learn one automation engine. Visual rules. Drag and drop. No retraining as you add functions.
But you still use Stripe for payments. SendGrid for marketing emails. Your accounting team loves QuickBooks. Legacy systems that aren’t going anywhere.
N8N integration opens the door to 400+ external apps through webhooks and HTTP requests. Send data out. Receive data in. Connect Luklak automation to anything with an API—without leaving the visual workflow builder or maintaining separate middleware subscriptions.
Internal automation: One Luklak engine. External connectivity: 400+ apps. No relearning new automation tools as your business grows.
What Disappears
Several operational rituals simply vanish:
Manual handoffs. Sales doesn’t email operations about closed deals. The automation creates the project automatically with full context.
Status update requests. “What’s the status?” becomes unnecessary when automation keeps related objects synchronized. Customer record shows real-time project status automatically.
Follow-up reminders. Humans don’t track overdue invoices or upcoming renewals. Automation handles time-based triggers, notifying the right person at the right moment.
Cross-system reconciliation. No weekly meetings to ensure CRM matches project tool matches finance system. They’re the same system. Automation keeps everything consistent.
Why This Architecture Matters
For operators: Build the automation you need. One visual rule spans sales, operations, finance. No integration APIs to manage.
For IT: Zero automation maintenance. No middleware subscriptions. No broken integrations to debug. Automation is native to the platform.
For executives: Operational intelligence becomes visible. See which automations run, how often, where bottlenecks occur. Optimization opportunities emerge from automation analytics.
When automation shares the same foundation as your data, workflows, and relationships—cross-functional processes automate natively. Sales triggers operations. Operations updates finance. Support escalates to engineering. No middleware required.
That’s Universal Automation. One engine. All functions. Zero friction.
Next in the series: Workviews & Dashboards — How to visualize work in any format without rebuilding the same data.
TL;DR: Your business doesn’t operate in isolated lists—it operates in a web of relationships. Yet your software treats a “Client,” a “Project,” and a “Contract” as strangers. Discover how the Object Picker turns your disconnected data into a living business graph.
It is 4:00 PM on a Friday. A support ticket lands in the queue: “The server is down.”
Your senior engineer, Sarah, is a professional. She sees the ticket. She sees the asset ID (SRV-884). She fixes the crash in 12 minutes. She closes the ticket, satisfied with a job well done.
On Monday morning, you receive a cancellation notice.
Why? Because SRV-884 wasn’t just a server. It belonged to Orion Logistics. And Orion Logistics was in the middle of a delicate contract renewal. And the Account Manager had specifically flagged that client as “High Risk.”
Sarah didn’t fail at engineering. She failed at context.
She fixed the server because that’s what the ticket told her to do. But she didn’t call the Account Manager because the ticket didn’t “know” about the renewal.
This is the penalty of Siloed Architecture. Your “Tickets” list doesn’t talk to your “Sales” list. Your “Assets” list is a stranger to your “Contracts” list. Your team is forced to make decisions looking through a keyhole, seeing only the immediate task but missing the business reality.
The End of the “Flat List”
Most business software is essentially a collection of fancy, disconnected spreadsheets.
The CRM knows who the customer is.
The Project Tool knows what work is being done.
The Finance System knows who hasn’t paid.
But in the real world, these things are inseparable. A “late payment” (Finance) impacts the “project timeline” (Operations), which changes the “renewal strategy” (Sales).
When your software keeps these objects separate, you create Context Blindness. You force your employees to be human bridges, manually checking three different systems to stitch together a picture that should be obvious.
The Business Graph: Wiring the Neural Network
To build a System of Intelligence, you need more than just “links.” You need to model the physics of your business. Luklak provides four distinct ways to wire your Business Graph.
1. The Object Picker: The “Neural Spine” (Dependency)
The Logic: “I belong to that.” (N-to-1)
The Use Case: Strong, directional ownership.
This is the “Data Tube” we discussed previously. It is the strongest bond in the system. When you use the Object Picker, you are declaring that Object A is dependent on Object B.
Example: A Support Ticket picks a Client. The Ticket cannot exist in a vacuum; it belongs to the Client. Because of this strong bond, the Ticket automatically inherits the Client’s context (SLA tier, Account Manager, Renewal Date).
When to use it: When you need to “reach through” to pull data (Dot Notation) or route approvals based on ownership.
2. The Object Link: The “Network” (Association)
The Logic: “We are related, but I don’t own you.”
The Use Case: Mapping the messy, many-to-many reality of business.
Unlike the Object Picker (which says “This Ticket belongs to that Client”), the Object Link creates a web. It answers the question: “What else is this related to?”
Here are 3 common scenarios where you need Links, not Pickers:
Scenario A: The “Talent Pool” (Recruiting)
The Problem: A candidate, John Doe, applies for the “Senior Designer” role. Two weeks later, he applies for the “Art Director” role.
The Intelligence: When you look at John’s profile, you see his entire history with your company—every role he’s applied for, linked in a timeline.
If you used an Object Picker, you’d have to choose: Does John belong to the Designer role or the Director role? He can’t belong to both.
The Object Link Solution: You create a Candidate object for John. You Link him to both Job Openings.
3. The Data Table: The “Container” (Embedding)
The Logic: “I am a detail inside you.”
The Use Case: Structured transactional data (Orders, Logs, Fees).
Traditional databases force you to make a messy choice. If you want to add “Line Items” to an Order, you usually have to create a completely separate object type called “Order Items.” Suddenly, your system is flooded with millions of tiny records that clutter your global search.
The Data Table field solves this by embedding a mini-database directly inside the parent object. It allows you to mix static data, object connections, and calculations in a single grid.
Here are the 3 most common patterns:
Pattern A: The “Shopping Cart” (Inventory & Calculation)
The Scenario: You are creating a Sales Order. You need to list 5 different products, their quantities, and calculate the total.
The Intelligence: You aren’t just typing text. By picking the Product object in Column 1, the table automatically pulls the current price from the Inventory system to do the math in Column 3. If the Inventory price changes later, you can choose to freeze this price or update it.
The Scenario: A Real Estate Contract has various closing costs that differ for every deal.
The Intelligence: You can add as many rows as needed. A “Total” field at the bottom sums up the column automatically and feeds into the Contract’s “Total Deal Value” field.
The Table Structure:
Row 1: “Legal Fee” – $500
Row 2: “Inspection” – $250
Row 3: “Transfer Tax” – $1,200
Pattern C: The “Maintenance Log” (History)
Scenario: You are tracking a Company Vehicle. You don’t need a separate “Ticket” for every oil change; you just want a running history on the Vehicle record.
The Table Structure:
Date: 12/01/2025
Service: “Tire Rotation”
Cost: $80
Technician (User Picker): @Mike
The Intelligence: This keeps the data local. When you look at the Vehicle, the history is right there. You don’t have to search for “Tire Rotation” in a global task list.
Why this matters: Data Tables keep your architecture clean. Global objects (like Projects and Clients) live in the main graph. Transactional details (like Line Items and Logs) live safely tucked inside them.
4. Parent-Child: The “Breakdown” (Strict Hierarchy)
The Logic: “I am a sub-unit of you.” (1-to-N)
The Use Case: Execution and progress tracking.
Infinite nesting is a trap—it is where work goes to die. Luklak enforces a strict 2-Level Structure: Parent and Child.
This is designed for execution. You have a Project (Parent) and Tasks (Children). You have a Goal (Parent) and Key Results (Children).
The Intelligence: Because this relationship is strictly defined, the status rolls up automatically.
If 5 out of 10 Tasks are “Done,” the Project automatically shows 50% progress.
If a Task (Child) is “Blocked,” the Project (Parent) automatically flags as “At Risk.”
3 Scenarios: When the Bigger Picture Changes Everything
When you stop managing “rows” and start orchestrating a “graph,” blind spots disappear.
1. The “Renewal” Defense (The Sarah Scenario)
The Siloed Way: Sarah sees a broken server. She fixes it. The client churns.
The Connected Way:
The Connection:Ticket → Server → Client → Renewal Status
The Logic: The system sees the ticket is for a client in “Contract Negotiation.”
The Outcome: Before Sarah even opens the ticket, the system automatically flags it as URGENT and auto-CCs the Account Director.
Sarah doesn’t just fix the server; she sends a personal note to the client, reassuring them during the negotiation. The renewal is saved.
2. The “Ghost” Budget
The Siloed Way: A Marketing Manager requests $10,000 for a new campaign. The Finance Director approves it because the “Marketing Budget” spreadsheet says they have funds.
The Connected Way:
The Connection:Budget Request → Campaign → Vendor Contracts
The Logic: The system checks the real commitments. It sees that while the cash hasn’t left the bank, there are 3 pending contracts connected to this campaign that haven’t been invoiced yet.
The Outcome: The system warns the Finance Director: “Approving this will cause an overspend of $4,000 based on pending contracts.” The blind spot is revealed before the money is spent.
3. The “Scope Creep” Trap (The Laika Scenario)
The Siloed Way: A client emails the Project Manager at a design agency: “Can we just make these 3 small changes to the layout?” The PM, wanting to be helpful, says “Sure” and assigns the task to a designer.
The Connected Way:
The Connection:Task → Project → Contract → Scope Definition
The Logic: The designer goes to start the task. The system checks the Contract linked to the Project. It sees that “Layout Revisions” are capped at 2 rounds, and this client has already used both.
The Outcome: The system automatically flags the task: “Billable Change Order Required.”
Instead of doing free work that eats into margins, the PM sends a quote for the additional scope. The client pays. The agency remains profitable.
The Power of “Dot Notation” (Reaching Through the Graph)
You don’t need to be a coder to traverse this graph. You just need to know how to “reach” through the connections.
In Luklak, we use a simple concept called Dot Notation. It allows you to pull context from anywhere in the network without moving data around.
Want to email the manager of the person who owns the server? Ticket.Server.Owner.Manager.Email
Want to check the total value of the client associated with a project? Project.Client.Total_Contract_Value
You aren’t creating new fields. You aren’t duplicating data. You are simply looking through the “Data Tube” to see the reality that already exists.
Stop Managing Islands
Your business is not a list of tasks. It is a complex ecosystem of relationships.
When you leave your data in silos, you strip away the context your team needs to make smart decisions. You turn intelligent operators into task-doers.
The Object Connection Lego reconnects the tissue of your organization. It ensures that when one thing happens—a server crashes, a deal closes, a budget is requested—the entire system understands what it means.
TL;DR: Your most expensive employees are acting as human middleware. Discover the hidden “Shadow Payroll” draining your budget—and why adding more integration tools is only making the problem worse.
The monthly business review is a corporate theatre of the absurd.
It usually happens on the third Tuesday. The VP of Sales presents a pipeline value of $4.2 million. The Head of Finance interrupts, pointing out that billed revenue is only $3.1 million. The Head of Customer Success looks confused, noting that according to their dashboard, active contract value is $3.8 million.
The meeting descends into an archaeological dig. Who pulled the data? When? Did the export include the pending renewals in Salesforce, or just the signed contracts in Xero?
For the next hour, your most expensive executives are not discussing strategy. They are debugging the definition of the word “customer.”
This ritual is the visible tip of an invisible crisis. Beneath the surface of modern operations lies a “shadow payroll”: the vast, unmeasured sum of money businesses spend paying smart people to act as human middleware.
Fragmentation by Design
The genesis of this crisis was innocent enough. In the quest for efficiency, the modern enterprise unbundled itself. Sales bought the best CRM; Engineering bought the best issue tracker; Finance bought the best ledger.
The result is a paradox: businesses have never possessed better tools, yet operational friction has never been higher.
According to Okta’s latest data, the average mid-market firm deploys 137 distinct applications. Each is a cathedral of logic, optimized for a specific priesthood. But cathedrals do not talk to one another.
This has birthed a new economic reality. Operations teams no longer manage operations; they manage the empty space between tools. They are the “Alt-Tab” generation, toggling between browser windows 1,200 times a day—a figure cited by Harvard Business Review—to manually ferry context from one digital island to another.
Gallup estimates this context switching costs the U.S. economy $450 billion annually. But for the individual operator, the cost is more visceral. It feels like swimming through glue.
When the System Snaps
Most leaders do not realize they have an architectural problem until they hit one of three specific breaking points. These are the triggers that bring people here:
1. The “Where Is It?” Panic
A client calls with a frantic request. To answer it, your account manager needs the contract (in Google Drive), the project status (in Asana), and the billing history (in QuickBooks).
The delay isn’t caused by a lack of competence; it is caused by the archaeology required to reassemble a single client’s reality from three different shards. When “knowing the customer” requires opening five tabs, you do not actually know the customer.
2. The New Hire’s Glaze
Watch a manager onboard a new employee. Listen to the apology that inevitably comes halfway through: “I know this seems weird, but we have to create the project in Tool A, then copy the ID number into Tool B, and don’t forget to tag Finance in Tool C or they won’t send the invoice.”
That apology is the sound of broken architecture. It is the admission that the process serves the tools, rather than the tools serving the process.
3. The Reporting Lag
The CEO asks a simple question: “How profitable was the Q4 marketing campaign?”
In a unified system, this is a query. In a fragmented one, it is a project. It requires an analyst to export ad spend, export CRM data, export billable hours, clean the CSVs, map the fields using VLOOKUP, and pray the data hasn’t changed in the interim. The answer arrives three days later—too late to be useful.
Bridging the Unbridgeable
The conventional cure for this malaise is “integration.” If the silos can’t speak, the logic goes, we will build bridges.
Companies hire engineers to write scripts connecting HubSpot to Jira. They purchase middleware platforms like Zapier or MuleSoft. They celebrate when the data flows.
But this solution is a mirage. Integration automates the movement of data, but it does not solve the fundamental problem: Schema Dissonance.
Consider the humble “Project.”
To the PM Tool, a Project is a collection of tasks and deadlines.
To the CRM, a Project is a deal stage with a dollar value.
To the Finance System, a Project is a billing code and a ledger of expenses.
Connecting these systems via API is like hiring a translator to run between three people shouting in French, German, and Japanese. You may achieve basic communication, but nuance is lost, and the latency is excruciating. Gartner finds that companies spend up to 40% of their engineering talent just maintaining these fragile bridges. When one system updates its API, the bridge collapses, and the shadow payroll expands.
Unifying the Atom
There is a quieter, more radical school of thought emerging: Architectural Unification.
This approach argues that the “best-of-breed” era was a mistake. It posits that the friction of fragmentation outweighs the benefit of specialized features.
The solution is not to connect disparate databases, but to build on a single, flexible foundation—what we call a Universal Object architecture.
In this model, a “Customer” is not three different records synchronized by scripts. It is a single object. Sales views it through a pipeline interface; Support views it through a ticket interface; Finance views it through a billing interface. But they are all looking at the same atom of data.
When Blue Media, a rapidly scaling agency, adopted this unified approach, the “Wednesday Morning Ritual” of data reconciliation vanished. They didn’t train their team to copy-paste faster; they removed the need to copy-paste entirely.
Auditing the Invisible
The $450 billion figure is abstract. Your organization’s share of it is not. To calculate the tax you are paying for fragmentation, apply this simple heuristic:
The Sync Tax: Estimate the hours per week your team spends exporting, importing, or reconciling data.
The Search Tax: Estimate the time spent looking for information that “should be right here.”
The Latency Tax: What is the cost of a decision made on Wednesday using Monday’s data?
For most mid-market companies, the sum of these taxes roughly equals the cost of their entire IT budget. You are paying for your software twice: once in license fees, and again in the labor required to compensate for its design.
The modern operator is tired of being a data janitor. They were hired to think, to build, and to sell. The organizations that win the next decade will be the ones that liberate their talent from the tyranny of the Alt-Tab.
TL;DR: Traditional software locks you into pre-defined fields or charges you thousands for “custom field” configuration. Data Fields give you 20+ field types and calculated formulas—no database design degree required.
Your VP of Sales walks into your office with a simple request: “Can we track which marketing campaign each deal came from?”
With traditional CRM software, this triggers a process:
Submit a feature request to IT
Wait for the next sprint planning
Pay for custom field configuration ($500-2,000 depending on vendor)
Wait 2-4 weeks for implementation
Train everyone on the new field
Your team needs to track campaign attribution today. The deal cycle doesn’t wait for your software vendor’s roadmap.
The Fixed Schema Problem
Most business software ships with fixed data structures. The “Customer” record has these fields. The “Project” record has those fields. If you need something different, you’re out of luck—or you’re paying for customization.
The hidden costs:
Workarounds. Teams repurpose existing fields. “Description” becomes a dumping ground for three different types of information. Good luck running reports on that.
Spreadsheet exports. When the tool can’t capture the data structure you need, people export to Excel and manage it there. Now you have two sources of truth.
Vendor lock-in. Custom field configuration means vendor dependency. Want to switch platforms? Good luck migrating your custom schema.
IT bottlenecks. Every new data requirement becomes a ticket. IT becomes the gatekeeper to basic operational flexibility.
20+ Field Types, Zero Database Design
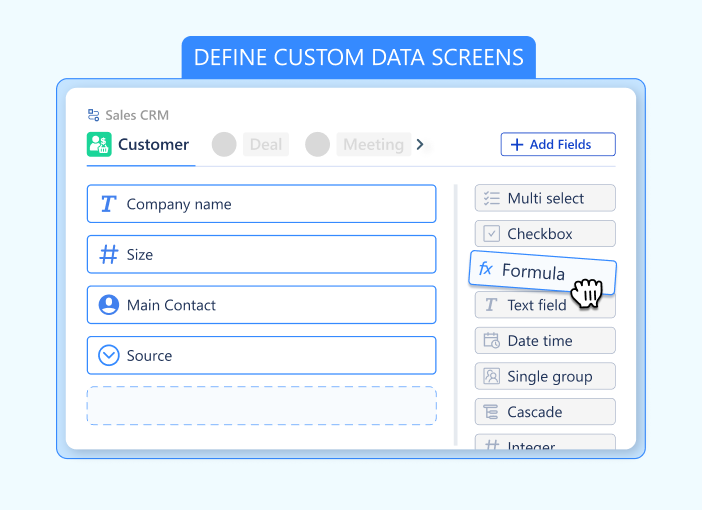
Data Fields in Luklak flip this entirely. Every Universal Object you create comes with unlimited custom fields—and you add them yourself, instantly.
Available field types:
Basic data capture:
Text (Single line or Paragraph)
Number (Integer, Decimal, Percent)
Currency (Multi-currency support)
Date & Date Time
Checkbox (True/False)
Email, Phone, & URL (with validation)
Selection and categorization:
Single Select (Dropdown)
Multi Select (Tags)
Rating (1-5 stars or custom)
Structure & Logic:
Object Picker (The universal connector)
Formula (Calculation engine)
Table (Mini-database inside a field)
User Picker (Assignees)
No database schema to design. No migration scripts to write. Just point, click, and define the field.
Formulas Without Code
Here’s where it gets interesting. Not only can you capture any data structure—you can calculate values automatically using formula fields.
LAIKA’s deal scoring example:
They needed to prioritize deals based on multiple factors: deal size, industry fit, urgency, and relationship strength. Traditional CRM would require:
The formula field calculates automatically. Change the deal amount? Score updates instantly. Adjust the weighting? Edit the formula once—every deal recalculates.
No separate BI tool needed. No nightly ETL jobs. Just formulas that calculate in real-time as underlying data changes.
Structured Data Within Data
Some information doesn’t fit into simple fields. You need nested structure.
Example: A construction project needs to track multiple cost estimates from different vendors.
The traditional workaround: Create a separate “Estimate” object, link it to the project, manage the relationship manually.
With Data Tables: Add a “Vendor Estimates” field directly on the project object. The field contains a table structure:
Vendor Name
Quoted Price
Delivery Time
Notes
Vendor A
$45,000
6 weeks
…
Vendor B
$42,500
8 weeks
…
Vendor C
$48,000
5 weeks
…
The data lives on the project object. No separate relationship to manage. The table is queryable, sortable, and visible right where you need it.
Other data table use cases:
Line items on invoices
Task checklists within projects
Contact history on customer records
Certification records on employee profiles
Inspection findings on equipment assets
Object Picker & Dot Notation: The Universal Data Tube
In traditional tools, connecting data is messy. You create a “Link” field, then a separate “Lookup” field to see details, then a “Rollup” to sum numbers. It’s cluttered and rigid.
Luklak eliminates this with the Object Picker.
Think of the Object Picker as a “data tube” that connects two objects. Once connected, data flows freely in all directions. You don’t need extra fields to see that data; you simply “reach through the tube” using Dot Notation.
Here are 3 real-world examples of how this replaces complex coding:
1. The Org Tree: Dynamic Approval Routing
You can build a complete hierarchy of your company using Object Pickers: Employee picks Team, Team picks Department.
When an employee submits a “Budget Request,” the automation doesn’t need to ask “Who is the manager?” You simply configure the workflow to assign the approval task to:
Request.Creator.Team.Manager
Why it matters: You don’t hard-code names. If you change the manager of the “Marketing Team” object, every future request routes to the new person automatically.
2. The Attribution Counter: ROI Tracking
You want to know how many customers came from a specific “Facebook Ad.” Instead of building complex reports, you just look at the Ad Object. Because the customers picked that Ad, the connection is already there.
You simply add a formula field on the Ad:
Ad.Customers.Count
Why it matters: As soon as a new customer signs up and references the Ad, the counter on the Ad object increments automatically (+1). You see your ROI in real-time without running a report.
3. The Context Link: Instant Data Inheritance
A Support Ticket is created for a specific Project. The support agent needs to email the client, but the client’s email is on the Client Object, not the ticket.
Instead of copying and pasting, you just use the connection path:
Ticket.Project.Client.Email
Why it matters: The email address lives in one place (the Client record). But it is accessible everywhere (Tickets, Projects, Invoices) instantly through the dot notation.
The Schema Evolution You Actually Need
Business requirements change. Your data model needs to evolve with them.
Week 3: Added industry classification and lead source tracking. Two new fields. Took 3 minutes.
Week 6: Introduced deal scoring. Added formula field. Took 5 minutes.
Week 9: Started tracking project profitability. Added rollup fields to sum costs. Took 10 minutes.
Week 12: Needed vendor comparison tables on projects. Added data table field. Took 15 minutes.
Zero IT involvement. Zero vendor fees. Zero downtime. The schema evolved as their business evolved.
Why This Matters for Operations
Capture exactly what you need. No forcing your data into someone else’s predetermined fields. No repurposing “Description” to hold six different pieces of information.
Calculate automatically. Profit margins, completion rates, days-until-deadline, weighted scores—any calculation you can define in a formula becomes a live field.
Query across everything. Because all fields exist in the Universal Object architecture, you can query them together. Show all customers where Industry = “Construction” AND Total_Project_Value > $100,000 AND Days_Since_Last_Contact > 30.
No export-to-Excel ritual. The data structure you need lives in the system. The calculations happen automatically. The reports run natively.
Field-Level Intelligence
Data Fields aren’t just storage—they’re smart.
Validation rules: Ensure email fields contain valid emails. Prevent negative numbers in quantity fields. Require specific formats for SKU codes.
Default values: New projects automatically inherit customer’s preferred currency. New tasks get assigned to project owner by default.
Required fields: Mark critical fields as required. Users can’t save the object until those fields are completed.
The Flexibility Tax You’re Not Paying
Traditional enterprise software charges you for flexibility:
Custom fields: $500-2,000 per field
Formula fields: Often unavailable or require professional services
With Data Fields: Add unlimited fields. Write formulas. Create data tables. Change your schema. All included. No fees. No waiting.
The flexibility tax disappears when your platform is built for customization from the ground up.
What This Means for Your Team
For operators: Stop forcing work into predetermined boxes. Capture information the way your process actually works.
For analysts: Stop exporting to Excel for calculations. Build formulas directly on your objects. Reports update automatically.
For managers: Stop waiting on IT for simple schema changes. Add fields when you need them. Evolve your data model as your business evolves.
When you can capture any data structure and calculate any formula—without database engineers or vendor fees—your operational data actually reflects how work happens. Not how someone else thinks it should be structured.
That’s why Data Fields matter. They let your information model evolve at the speed of your business.
Next in the series: Object Connections — How to relate anything to anything without foreign keys or join tables.
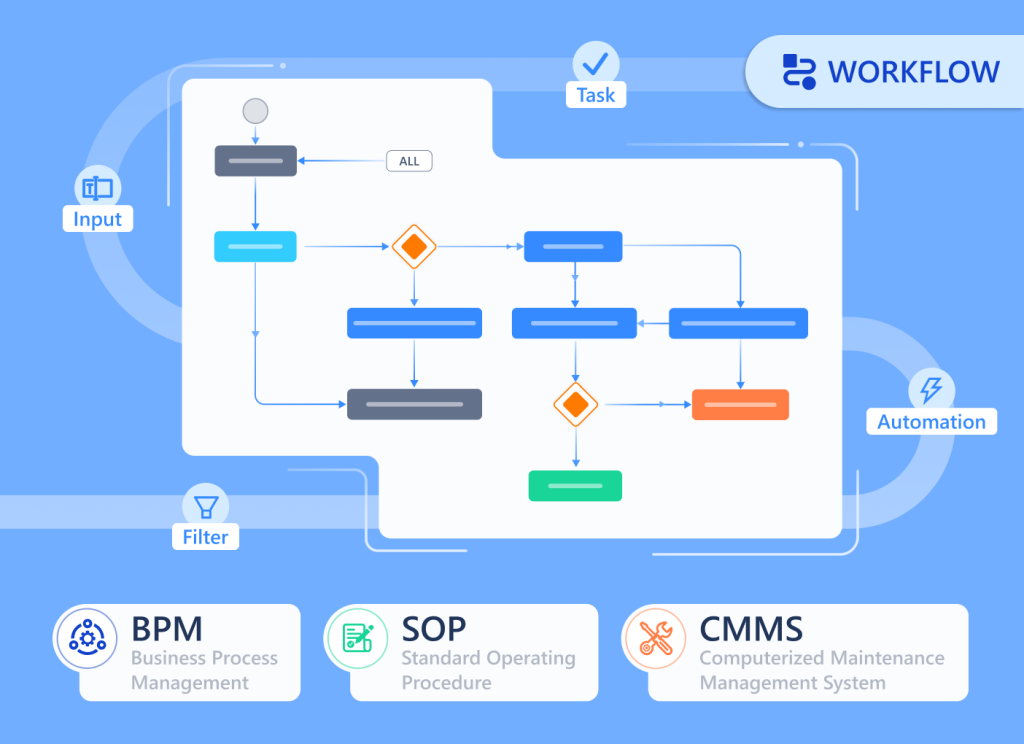
TL;DR: Separate workflow tools force you to mirror your work elsewhere. Universal Workflow embeds process directly into every object—so your sales pipeline, project stages, and support queues share the same automation engine.
Your sales team tracks deals in the CRM. Your operations team manages projects in a project tool. Your support team triages tickets in a helpdesk.
Each tool has its own workflow system. Each one requires separate configuration. Each one speaks a different automation language.
When a deal closes, someone manually creates the project. When the project hits a milestone, someone manually updates the customer. When support escalates an issue, someone manually creates the task. Your team doesn’t work across three workflow engines because they want to—they do it because the tools force them to.
The Workflow Tax
Traditional business software treats workflow as an afterthought—a feature bolted onto static data tables. You get a CRM that stores customer records. Then you get a separate “workflow module” to move deals through stages. The workflow system sits on top of your data, not inside it.
The problems compound:
Configuration drift. Your CRM workflow works differently than your project workflow. Different triggers. Different actions. Different automation syntax.
Integration overhead. Want the sales workflow to trigger the operations workflow? Write custom integration code. Debug when it breaks. Pay for middleware.
Duplicated logic. The same approval process lives in three places with three different configurations. Change the business rule? Update it everywhere.
Limited scope. Workflows can only see the data in their own system. Cross-functional automation requires external tools like Zapier—at $30+ per 1,000 tasks.
Process as Core Architecture
Universal Workflow flips this model. Instead of bolting workflow onto data, Luklak embeds workflow directly into every Universal Object you create.
When you build a “Customer” object, workflow stages come built in. When you create a “Project” object, process automation is already there. When you design a “Support Ticket” object, status progression is native.
This means:
Every object type you create automatically includes:
Visual workflow stages — Define how objects move through your process
Drag-and-drop interface — Move work items between stages with one click
Status tracking — Every object knows exactly where it is in the process
Stage-based automation — Trigger actions when objects enter or leave stages
Cross-object workflows — One workflow can span multiple object types seamlessly
The workflow engine isn’t a separate tool. It’s part of the Universal Object foundation.
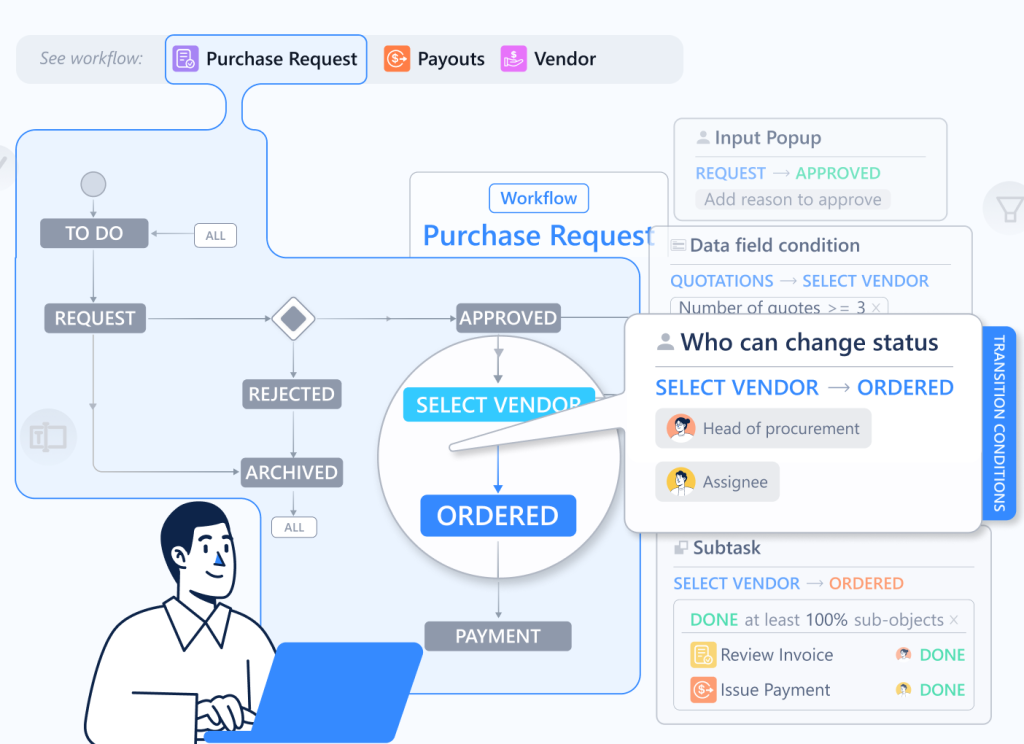
How It Actually Works
Let’s walk through LAIKA’s implementation.
Marketing creates a campaign object. It has stages: “Planning → Active → Completed → Analyzed.” When a campaign moves to “Active,” Universal Automation notifies the sales team and creates connected Lead objects for incoming inquiries.
Sales works with Lead objects. Their workflow: “New → Contacted → Qualified → Proposal → Negotiation.” When a lead reaches “Qualified,” the system automatically:
Assigns the deal to the appropriate account executive based on deal size
Notifies the finance team to prepare contract templates
Deal closes. The moment it hits “Closed-Won”:
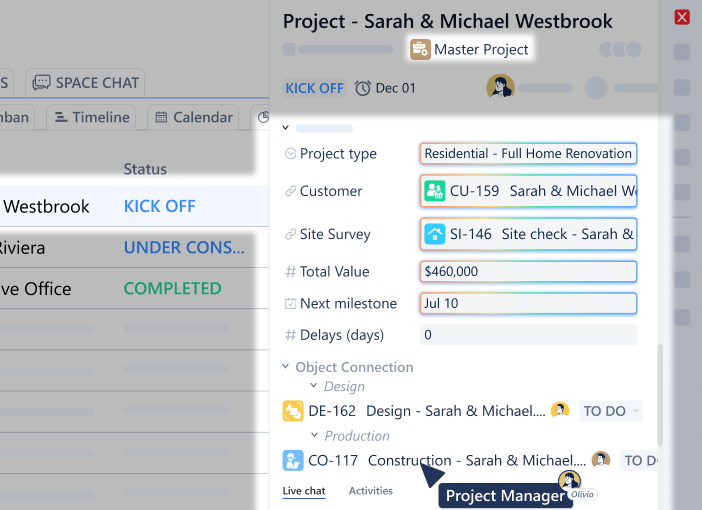
A Project object is created automatically (workflow: “Kickoff → Design → Build → Review → Delivery”)
The project inherits all customer context from the deal
Task objects are generated based on project type (each with their own workflow)
The operations team gets notified with full context—no manual handoff needed
Project progresses through stages. When the project moves to “Review”:
Client Success team gets automatically assigned
An Invoice object is created (workflow: “Draft → Sent → Paid → Closed”)
The finance system updates revenue recognition
The customer sees project status change in their portal
Four different object types. Four different workflows. Zero integration code.
Because every workflow is built on the same Universal Workflow engine, they compose automatically. Sales workflows trigger operations workflows. Operations workflows create finance workflows. Support workflows update project workflows.
The Visual Process Design
Here’s what makes Universal Workflow different from traditional state machines or business process management systems:
Stages are declarative. You define stages as clear milestones: “Lead → Qualified → Negotiation → Closed.” Not complex state diagrams with dozens of conditional branches. Just the natural progression of work.
Movement is visual. Drag an object from “In Progress” to “Review.” The workflow engine handles everything that should happen when that transition occurs. No clicking through menus. No filling out transition forms.
Automation is stage-triggered. “When a deal enters Closed-Won, do these five things.” Not “when field X changes to value Y and condition Z is met.” The stage transition is the trigger. The complexity hides behind simple milestones.
History is automatic. Every stage transition is logged with timestamp and user. You can see exactly how any object moved through its workflow. No manual status updates in comment fields.
Cross-Functional Workflow Without Integration
Traditional tools make cross-functional workflows painful. You’re working across separate systems with separate workflow engines.
Example: A support ticket escalates to a bug, which blocks a feature request, which delays a project, which impacts a customer contract.
With separate tools:
Create the bug manually in the dev tracker
Link it manually to the feature request
Update the project timeline manually
Email the account manager manually
Update the contract status manually
With Universal Workflow & Automation:
Support creates a Bug object from the ticket (one click)
The bug automatically links to the related Feature Request object
The feature request’s workflow triggers: “When linked bug is created, move to Blocked status”
One workflow engine. Multiple object types. Automatic composition.
Stage-Based Intelligence
Because every object knows its workflow stage, you can build intelligence on top:
Time in stage. How long has this deal been in “Negotiation”? Universal Workflow tracks automatically. Set thresholds: “If in stage > 14 days, escalate.”
Stage velocity. Which leads move fastest from “Contacted” to “Qualified”? Which projects get stuck in “Review”? The data is native—no external analytics needed.
Bottleneck detection. Twenty projects piled up in “Design” stage? The dashboard shows it immediately. You’re not waiting for a weekly report.
Conversion rates. What percentage of leads make it from “Qualified” to “Closed-Won”? Universal Workflow calculates this across any object type—customers, projects, tickets, anything.
What You Get Out of the Box
When you create any object type in Luklak, Universal Workflow gives you:
Kanban views. See your workflow visually. Drag objects between stages. Filter by assignee, due date, or custom fields.
List views. Traditional table layout grouped by stage. Sort, filter, and bulk-edit objects.
Timeline views. Plot objects across time to see how work flows through stages. Identify bottlenecks and capacity constraints.
Start with three stages. Grow to thirteen. The engine doesn’t change.
LAIKA began with simple workflows: “New → In Progress → Done.” As their operations matured, they added nuance: “Kickoff → Design Draft → Client Review → Revision → Final Design → Construction → Inspection → Delivered.”
The workflow engine scaled seamlessly because it’s not a separate configuration layer—it’s built into the object architecture.
Why This Architecture Matters
For operators: Work happens in one place. The workflow follows the work object. No separate tool to configure. No manual status updates across systems.
For managers: Real-time visibility into process flow. See bottlenecks immediately. Measure cycle time natively. Optimize workflows without extracting data.
For executives: One workflow engine across all functions. Sales, operations, support, finance—all using the same automation architecture. Consistent process data. Unified reporting.
When workflow is built into your objects—not bolted on top—your processes compose automatically. Sales triggers operations. Operations updates finance. Support escalates to engineering. No integration middleware. No workflow translation. Just native process automation across everything you build.
That’s Universal Workflow.
Next in the series: Data Fields & Formulas — How to capture any information structure without database design.
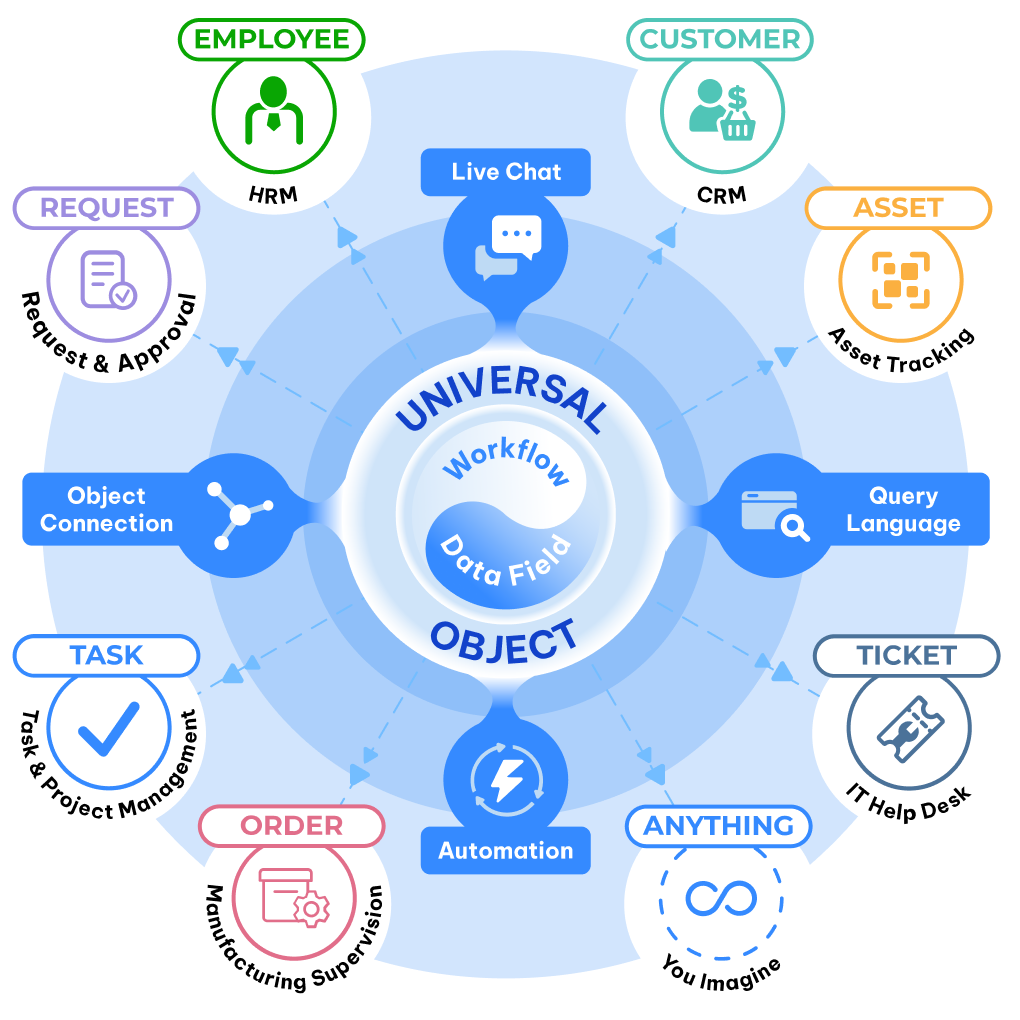
TL;DR: Most software forces your business into their boxes. Universal Objects flip this—giving you molecular building blocks that snap together automatically, so you build what you actually need.
Every Tuesday morning, your operations team begins the ritual.
Export customer data from the CRM. Copy project details from the project tool. Pull support tickets from the helpdesk. Paste everything into a spreadsheet. Spend ninety minutes reconciling why the same customer has three different IDs across three different systems.
This isn’t a training problem. It’s an architecture problem.
The Pre-Built Module Trap
Traditional business software arrives with pre-built modules: a “CRM module,” an “HR module,” a “Project module.” Each module comes with:
Fixed data structures you can’t change
Pre-defined fields you adapt to (not the other way around)
Limited relationships between modules
Separate databases requiring integration
The result? You force your business processes into someone else’s assumptions about how work should flow.
Your sales process has seven stages, but the CRM only supports five. You need to track equipment maintenance, but there’s no “equipment module.” You want to link customers to projects to invoices, but each lives in a separate system with its own data model.
Custom fields cost extra. Integrations break. Your team becomes data translators instead of operators.
One Foundation, Infinite Possibilities
Universal Objects work differently.
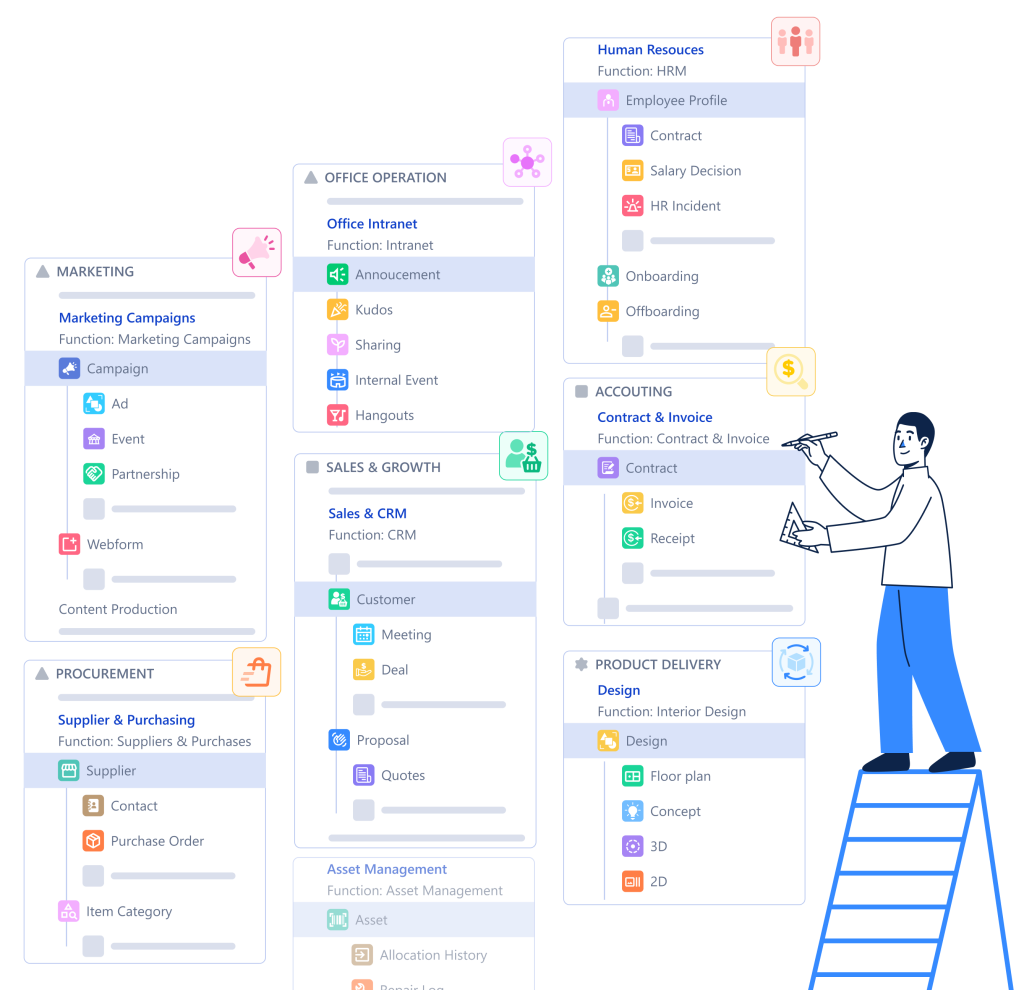
Instead of giving you hardcoded modules, Luklak gives you a flexible foundation for creating any business entity you need. Think of it like building construction—you can build houses, offices, or factories, all sitting on the same type of foundation. Plumbing, electrical, and HVAC work the same way across different buildings.
In Luklak, you create:
A “Customer” object
An “Employee” object
An “Equipment” object
A “Support Ticket” object
anything…
Underneath, they all share the same Universal Object architecture. That’s why they:
Connect natively — No integration APIs needed
Query together — One query language across everything
Automate together — Workflows span any objects
Chat together — Unified communication embedded to each Object
The Architecture That Changes Everything
Here’s what makes Universal Objects different from traditional database records or spreadsheet rows:
Native workflow built in. Every object type you create automatically includes workflow stages. Customer objects move through “Lead → Qualified → Negotiation → Closed.” Support tickets flow through “New → In Progress → Resolved.” You define the stages. The workflow engine is already there.
Embedded communication. Every single object instance has live chat built directly into it. Discuss the customer record ON the customer record. Talk about the project ON the project. Context never gets lost in separate Slack threads.
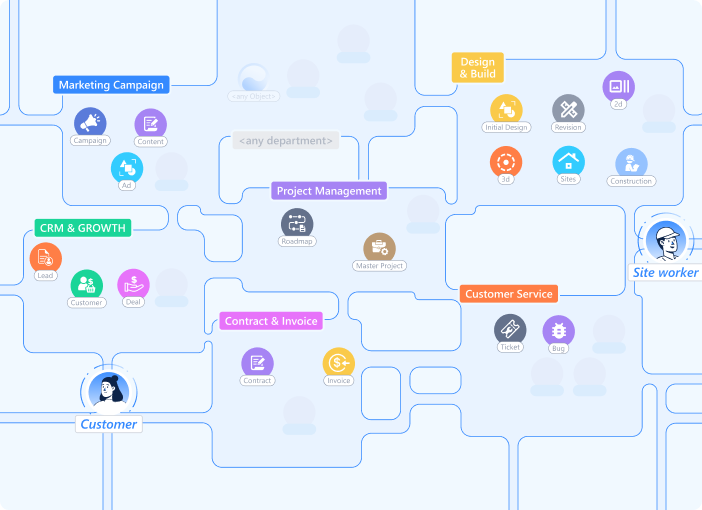
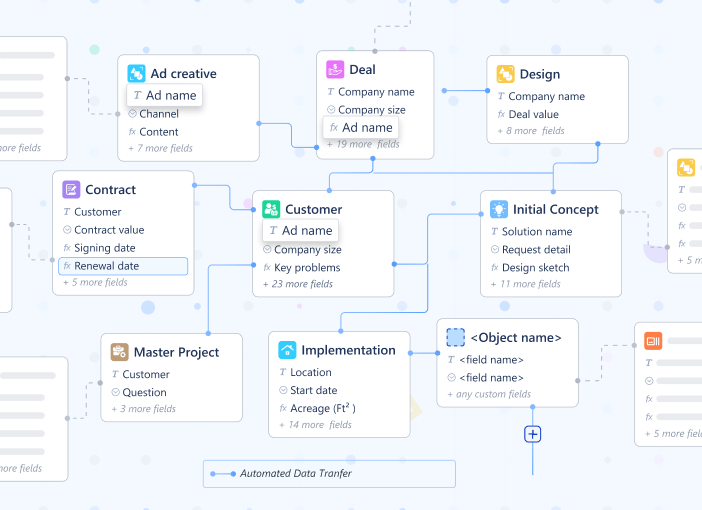
Universal relationships. Connect any object to any object. Customer → Orders → Projects → Invoices. Parent → Children → Subtasks. The relationship engine is bidirectional, queryable, and visual. No foreign keys to manage. No join tables to configure.
Automatic inheritance. When you build automation, permissions, or views at the object type level, every instance inherits those capabilities. Define a workflow once. Every new customer record follows it. Set permissions on “Project” objects. Every project respects them.
Why This Matters for Real Operations
Let’s see how this plays out at LAIKA, an interior design firm that switched from scattered tools to Luklak.
Before: Marketing ran campaigns in one tool, Sales tracked leads in a CRM, Project Management used a separate platform, and Accounting lived in yet another system. When a lead became a customer, someone manually created matching records in three different places. When project status changed, someone manually updated the CRM. When invoices were sent, someone manually noted it in the project tool.
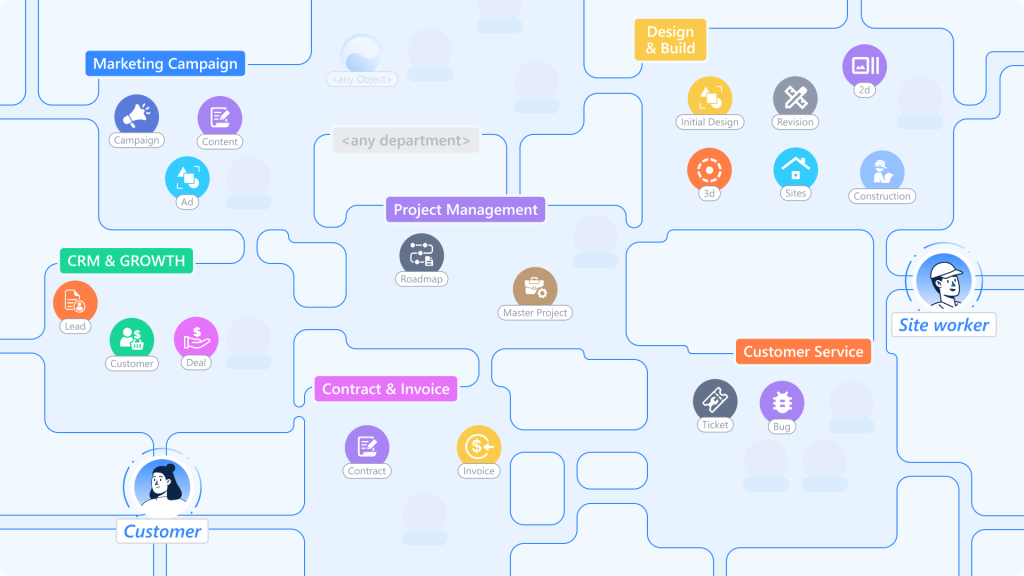
After: LAIKA built everything from Universal Objects:
Marketing Campaign object (tracks campaigns with budget, timeline, performance)
Lead object (captures inquiries, automatically connects to source campaign)
Customer object (inherits lead data, connects to contracts)
Project object (links to customer, creates task hierarchy)
Invoice object (references project, auto-populates from project data)
Because all five object types share the Universal Object foundation, they connect automatically. When Marketing converts a lead, Sales sees it instantly. When Sales closes a deal, Project Management gets notified with full context. When projects hit milestones, Accounting triggers invoices. No manual handoffs. No duplicate data entry. No reconciliation spreadsheets.
What You Can Build
The same nine Universal Object capabilities appear in everything you create:
Customer relationship management. Build your CRM exactly how your sales process actually works—not how off-the-shelf tools think it should work.
Project and task management. Create project hierarchies, task dependencies, and resource allocation that match your delivery methodology.
HR and people operations. Model employees, positions, departments, performance reviews, and time-off tracking in your organizational structure.
Asset and inventory tracking. Design equipment registries, maintenance schedules, and location tracking for your specific asset types.
Support and ticketing systems. Configure ticket types, priority schemes, and escalation rules for your support workflow.
Custom workflows. Build anything your business needs—vendor management, compliance tracking, equipment rentals, membership programs.
The common thread? They’re all built from the same Universal Object foundation, so they work together automatically.
The Integration Tax You’re Not Paying
Traditional business software charges you integration tax—the hidden cost of connecting systems that weren’t designed to work together.
Zapier fees. Pay per task to move data between disconnected apps. Engineering time. Spend 30-40% of development resources maintaining integrations. Sync delays. Wait 4-48 hours for data to propagate across systems. Broken workflows. Debug integration failures when APIs change. Data inconsistency. Reconcile mismatches when systems define “customer” differently.
With Universal Objects, there is no integration tax. Everything shares the same data model, same query language, same automation engine. You build once. It works everywhere.
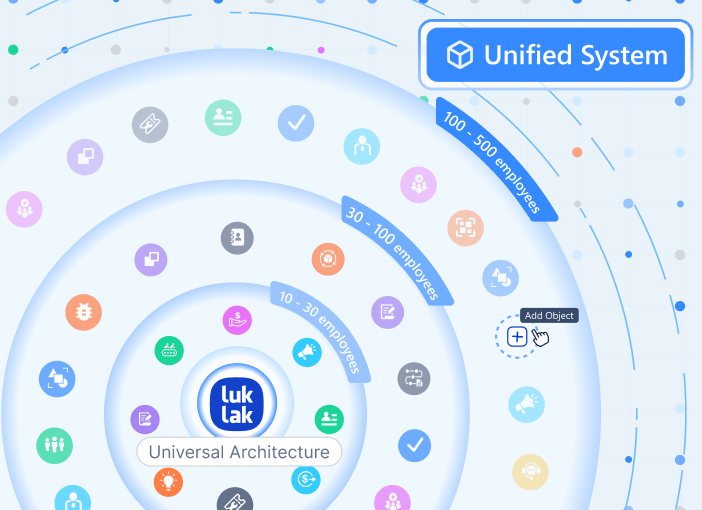
The Foundation That Scales
Start with three object types. Grow to thirty. The architecture doesn’t change.
Early-stage startups build their first CRM and project tracker in days. Mid-market companies model complex operations with dozens of interconnected object types. Enterprises run entire business units on hundreds of custom objects and thousands of automation rules.
The ceiling doesn’t exist because you’re not working within someone else’s module limitations. You’re working with architectural building blocks that compose infinitely.
What This Means for Your Team
For operators, it means no more data translation. Build the workflow you need. Connect it to everything else. Query across all your data in one place.
For executives, it means one source of truth. Every department works in the same system with the same data model. Real-time visibility without integration delays.
For IT, it means zero integration debt. No middleware to maintain. No APIs to version. No sync jobs to monitor. Just one unified architecture.
The foundation changes everything else you build. When your CRM, your projects, your support tickets, and your finance data all share the same Universal Object DNA, they work together automatically. Not through integrations. Not through middleware. Through shared architecture.
That’s what makes Luklak unified—not just connected.
Next in the series: Universal Workflow — How every object gets native process automation built in.
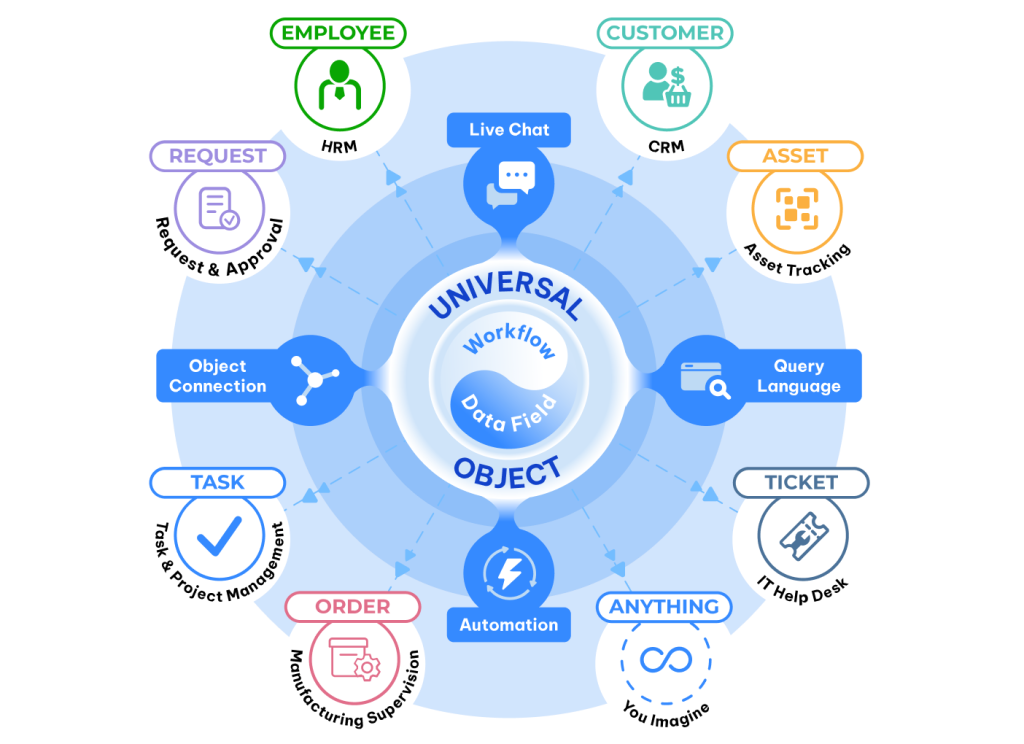
When we say Luklak uses “unified architecture,” we’re not making a marketing claim. We’re describing a specific technical approach: everything you build shares the same nine foundational components.
Think about LEGO. You can build a spaceship, a castle, or a city—not because LEGO gives you pre-built spaceship modules, but because every brick shares the same connection system. The studs on top, the tubes underneath. That consistency is what makes infinite combinations possible.
Luklak works the same way. Whether you’re building a CRM, project management system, HR portal, or support desk, you’re using the same nine components. They snap together perfectly because they were designed together from the start.
This isn’t how most business software works. And the difference matters more than it sounds.
The Alternative: Pre-Built Modules That Don’t Quite Fit
Traditional platforms give you separate modules: a CRM module, a project module, an HR module. Each module has its own data structure, its own workflow engine, its own permissions system. They’re different products bolted together, not components sharing a foundation.
The result: Integration becomes your full-time job. When your sales team closes a deal in the CRM module, it doesn’t automatically create a project in the project module—because they’re fundamentally separate systems. So you build connectors. You write sync scripts. You hire integration specialists.
According to Gartner, companies spend 30-40% of engineering resources maintaining these connections. That’s three engineers out of ten writing glue code instead of building features.
Unified architecture eliminates this entire category of work. When everything shares the same foundation, there’s nothing to integrate.
The Nine Components (And Why Each One Matters)
1. Universal Object: The Foundation
Every business entity you create—customer, project, asset, ticket, employee—is built from the same Universal Object foundation. Not separate databases requiring synchronization. One data model, infinite variations.
Why this matters: When a customer closes a deal, that customer object can instantly relate to the project object, which connects to the task objects, which link to the employee objects. No API calls. No data translation. No sync delays.
2. Universal Workflow: Process Built In
Every object type can have workflow stages. New → In Progress → Review → Complete. Drag-and-drop between stages. Visual pipeline management built into the foundation, not bolted on as a separate tool.
The difference: You’re not buying a workflow tool and integrating it with your data. Workflow is native to every object you create.
3. Data Fields: 20+ Types, Unlimited Flexibility
Text, numbers, dates, currency, dropdown selections, file attachments, user assignments, formulas, data tables, object references. Every field type you need, available for any object type you build.
Why standardization matters: When every object uses the same field types, reporting across objects is trivial. A date field in your customer object works exactly like a date field in your project object—so querying “all customers with active projects in Q1” is one line of code, not three system queries with manual reconciliation.
4. Object Connections: Native Relationships
Connect any object to any object. Customer → Project → Task → Employee. One customer can have multiple projects. One project can have multiple tasks. One employee can be assigned to multiple tasks across multiple projects.
The insight most platforms miss: Relationships aren’t just about linking records. They’re about navigating context. When you’re looking at a customer record, you should instantly see all related projects, all open tasks, all assigned employees—without switching between systems.
5. Unified Livechat: Communication Where Work Happens
Every object has chat built in. Discuss the customer ON the customer record. Discuss the project ON the project record. Context never gets lost because the conversation lives where the work lives.
Compare this to Slack: When you discuss a customer in Slack, the conversation is separate from the customer data. Someone joins the team next month—they have to ask “which customer are we talking about?” With unified chat, the conversation is part of the customer record. New team members see the full context immediately.
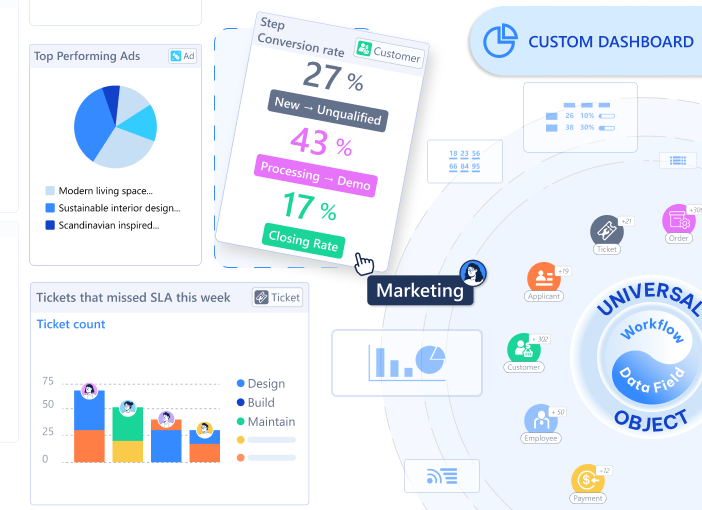
6. Workviews & Dashboards: Multiple Perspectives, One Foundation
View the same data as a list, Kanban board, calendar, timeline or dashboards. Switch between views instantly because they’re all pulling from the same objects.
The hidden advantage: When your sales team views customers as a Kanban pipeline and your finance team views them as a list sorted by revenue, they’re looking at the same data. Changes appear instantly in both views because there’s only one source of truth.
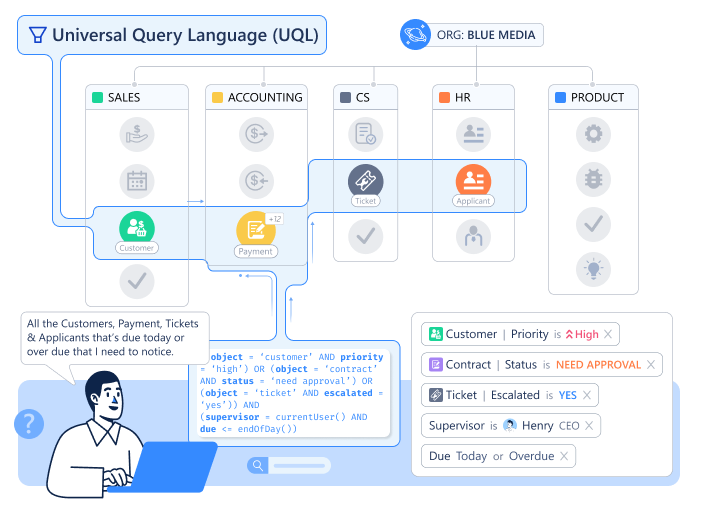
7. Universal Query Language (UQL): Think, Query, Total Clarity
Query across all your data with one language. “Show me all customers with active projects in the construction industry where the project value exceeds $50K and the project manager is located in APAC.”
Why this is hard in traditional systems: That query touches customer data, project data, industry classifications, employee locations. In a typical setup, that’s four different databases requiring four separate queries and manual joining. With UQL, it’s one query across unified objects.
8. Universal Automation: Logic That Spans Functions
When a deal closes, create a project. When a project starts, assign tasks. When a task completes, notify the customer. Automation works across any objects you create because they all share the same automation foundation.
The power multiplier: You’re not limited to “CRM automation” or “project automation.” You can automate across functions because there are no functional boundaries.
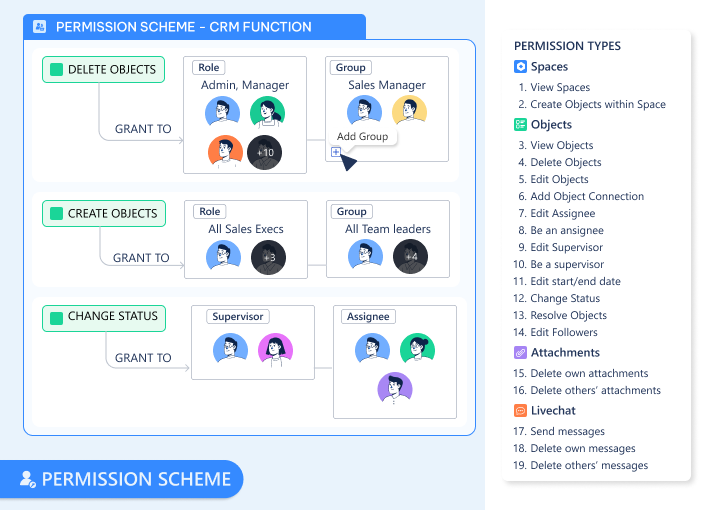
Define who can view, edit, or delete any object. Set permissions at the field level—sales sees customer revenue, support doesn’t. Configure notifications that route to the right people based on role, assignment, or custom logic.
The consistency advantage: You learn the permission system once and apply it to everything you build. There’s no “CRM has role-based security but projects use groups and HR uses custom ACLs.” One permission model, applied universally.
Why “Unified” Isn’t Just Marketing
Here’s the test: How many times do you define “customer”?
Traditional platforms: Once in the CRM, once in the billing system, once in the support platform. Three definitions requiring synchronization.
Unified architecture: Once. Every function you build references the same customer object.
That difference compounds. When you have 50 object types (customers, projects, employees, assets, invoices, tickets, etc.), the traditional approach creates exponential integration complexity. The unified approach creates zero integration work.
Blue Media, a Vietnamese marketing agency, describes the shift simply: “We stopped managing system boundaries and started managing work.”
What This Enables (That You Can’t Do Otherwise)
Cross-functional workflows without integration work When a customer support ticket escalates, automatically create an engineering task and notify the product team—because support tickets and engineering tasks are both just objects sharing the same foundation.
Reporting that spans the entire business “Which customer segment has the highest project completion rate and lowest support ticket volume?” That’s one query in UQL, not three reports manually combined in Excel.
Context that never fragments Every conversation, every document, every data point related to a project lives on the project object. New team members don’t ask “where’s the project information?”—it’s all in one place.
Changes that propagate instantly Update a customer’s industry classification once. Every dashboard, every report, every automation that references that customer sees the update immediately. No sync delays. No stale data.
The Architecture Question
Most platforms ask: “What modules do you need?” Luklak asks: “What will you build with these nine components?”
The first question assumes your business fits pre-defined categories. The second question assumes your business is unique and gives you the foundation to build accordingly.
Both approaches work. Traditional platforms with pre-built modules serve millions of companies successfully. But they work by forcing your processes to fit their architecture.
Unified architecture works by letting you build the architecture your processes actually need.
The choice is: Do you adapt your business to the software, or build software that adapts to your business?
For most operations teams, that’s not really a choice at all.
Every Wednesday at 9 AM, your finance team begins the ritual.
Export from Stripe. Paste into Excel. Copy to Salesforce. Update the dashboard. By noon, three people have touched the same numbers four times. None of this is in anyone’s job description.
When you hired a Head of Finance, you didn’t write “data translator” in the role description. Yet that’s what 60% of their time has become—not analysis, not strategy, just translating between systems that can’t speak the same language. Your finance team isn’t working with money anymore. They’re working with the architecture of your software stack.
This Wednesday morning ritual happens in every department. Operations copies inventory data from your warehouse system to your fulfillment platform. Customer success manually syncs account health scores from your product analytics into your CRM. Your project managers update timelines in three different places because each stakeholder uses a different tool.
The pattern is universal: businesses don’t lack data—they drown in the work of moving it between disconnected islands.
The Copy-Paste Economy: How Operations Teams Became Data Translators
If this feels familiar, you’re not experiencing a unique failure. You’re experiencing the architecture of modern business software.
The average mid-market company now uses 137 different applications, according to Okta’s 2024 “Businesses at Work” report. That’s not the problem. The problem is that each of those 137 systems defines the same business entities differently. “Customer” means one thing in your CRM, something slightly different in your support platform, and something else entirely in your billing system.
Your operations team doesn’t spend their time translating data because they’re inefficient. They translate data because your systems speak 137 different languages.
Research from Harvard Business Review found that knowledge workers switch between applications and websites nearly 1,200 times per day. These aren't just app switches—they're cognitive context switches. Every time someone moves from your CRM to your project management tool to your finance system, they're not just switching screens. They're switching data models, switching object definitions, switching mental maps of how information connects.
The University of California, Irvine studied this phenomenon and found it takes an average of 23 minutes and 15 seconds to fully regain focus after a significant interruption. Even brief switches—the kind that seem harmless—accumulate into hours of lost productive time. According to research compiled by Qatalog, context switching could be draining up to 40% of productivity every single day.
Scale that across millions of workers, and you arrive at Gallup’s estimate: context switching costs the US economy approximately $450 billion annually in lost productivity.
But the real cost isn’t measured in billions. It’s measured in Wednesday mornings. In the ritual of copying data that should flow automatically. In the operational work that exists only because your systems don’t share a common foundation.
This Isn’t a Training Problem—It’s an Architecture Problem
The conventional explanation for this waste goes something like: “Our team just needs better processes. We should standardize our data entry. We need more discipline around keeping systems updated.”
That explanation misses the point. The inefficiency isn’t a people problem. It’s a fundamental architectural mismatch.
Consider what happens when you add a new customer to your business:
Your CRM creates a Customer record with fields for Company Name, Industry, Annual Revenue, Contact Person, and Deal Stage. The CRM’s data model assumes customers are always companies pursuing deals.
Your support platform creates a different Customer record with fields for Email, Support Tier, Ticket History, and CSAT Score. The support system’s data model assumes customers are people who need help.
Your billing system creates yet another Customer record with fields for Payment Method, Billing Cycle, MRR, and Account Status. The billing model assumes customers are financial relationships.
Same customer. Three different definitions. Three different data structures. Three separate databases that require manual synchronization or complex integration code to stay aligned.
This isn’t about discipline. You can’t discipline your way out of schema fragmentation. When every system defines “customer” differently at the database level, translation work becomes structurally necessary.
Research from MuleSoft's 2025 Connectivity Benchmark Report reveals that only 28% of enterprise applications are actually integrated. The average organization runs 897 applications, and 95% of IT leaders report that integration issues actively impede their AI implementation efforts.
That last statistic matters. The promise of AI-driven business intelligence depends entirely on unified, clean data. But when your data lives in 137 different structures across disconnected systems, you don’t have data—you have fragments. AI can’t fix fragmented architecture. It requires architectural unification as a prerequisite.
The Hidden Tax: What Schema Fragmentation Actually Costs
Let’s make the invisible visible. Here’s what schema fragmentation—the technical term for “every system defines things differently”—actually costs your organization:
1. Engineering Resource Drain
Gartner’s 2024 analysis found that companies spend 30-40% of their engineering resources maintaining integrations between systems. Not building new features. Not improving products. Not automating processes. Just keeping systems talking to each other.
Think about what that means. If you have a team of 10 engineers, 3-4 of them exist primarily to write and maintain the glue code between your disconnected tools. That’s $300K-$400K annually in salary alone, spent on work that creates no direct business value.
And it’s fragile work. Every time one of your 137 applications updates its API or changes its data structure, those integrations break. According to Informatica’s 2024 report, 79% of organizations have undocumented data pipelines, and 57% report that business needs change before integration requests are even fulfilled.
The average data pipeline takes up to 12 weeks to develop. By the time it’s ready, the business requirements have often moved on.
2. Decision Latency
Forrester’s 2024 Operations Survey found that the average delay between when data updates in one system and when it appears in another ranges from 4 to 48 hours in 73% of organizations.
That lag matters more than it sounds. When your sales team closes a deal on Monday but your support team doesn’t see the new customer record until Wednesday, they can’t provide informed service. When your finance team is working off yesterday’s revenue numbers to make today’s hiring decisions, they’re making strategic choices with stale information.
This isn’t about wanting real-time dashboards for the sake of pretty visualizations. It’s about the compound effect of systematic delay. Every decision made on outdated information is a decision made in the dark.
3. Cognitive Load and Mental Fragmentation
The productivity loss from context switching isn’t just about time. It’s about the mental cost of maintaining multiple data models simultaneously.
When your operations manager needs to understand how a project is progressing, they have to:
Check the project management tool for task completion
Switch to the CRM to see customer communications
Jump to the finance system to verify budget status
Open the time tracking tool to see resource allocation
Pull up Slack to find the latest team discussion
Each switch requires them to remember: “In this system, projects are organized by client. In that system, they’re organized by team. In this other system, they’re organized by budget code.” They’re not just switching tools—they’re switching mental models of how the business is structured.
Research from Carnegie Mellon shows that even brief interruptions can increase task completion time by up to 23%. For complex cognitive work like operations management, the cost multiplies. When you’re juggling five different mental models, you’re not working at 80% capacity. You’re working at 40% capacity while feeling like you’re working at 120%.
4. The Invisible Work Multiplier
The most insidious cost is the work that exists only because of fragmentation—work so normalized it’s become invisible.
Weekly reconciliation meetings to align data between systems
Manual export/import cycles to keep information synchronized
Dedicated roles (“Salesforce admin,” “integration specialist”) that exist solely to manage system boundaries
Training overhead teaching new hires six different interfaces for what’s conceptually the same information
Audit trails scattered across multiple systems when compliance requires unified documentation
A 2024 Intuit QuickBooks survey found that businesses spend an average of 25 hours per week reconciling data across applications—that’s 1,300 hours annually. At an average fully-loaded cost of $75/hour for knowledge workers, that’s nearly $100,000 per year in reconciliation work alone.
And that’s just the measurable overhead. The unmeasurable cost is in the questions that never get asked, the analyses that never get run, the insights that never surface—because pulling the data would require touching eight different systems.
Why Integration Doesn’t Solve Fragmentation
The conventional solution to this problem is integration. Build APIs. Use middleware platforms. Connect everything. Make the data flow automatically.
Integration helps. Automated data sync is better than manual copy-paste. But integration doesn’t eliminate the fundamental problem—it just automates the translation layer.
Here’s why:
Integration maintains separate schemas. Your CRM still defines “customer” one way, your support platform defines it another way, and your billing system defines it a third way. The integration code translates between them, but the underlying fragmentation remains.
Integration creates coupling without unification. When System A updates its data model, the integration to System B breaks. When you add a new field to your customer definition, you need to update not just the CRM, but also every integration that touches customer data. The complexity grows exponentially with each new connection.
According to research from Future Processing, poor data quality—the kind of inconsistencies that arise from maintaining separate schemas—demands extensive data cleansing and validation before accurate integration can even occur. The hidden costs of data quality issues substantially impact integration project budgets by introducing extra layers of work and complexity.
Integration platforms themselves become another layer. Tools like Zapier, MuleSoft, or custom-built middleware add their own complexity, their own failure modes, their own maintenance overhead. You’ve replaced the problem of disconnected systems with the problem of managing the system that connects the disconnected systems.
A revealing statistic from IT Convergence: when organizations attempt to centralize fragmented data, they frequently discover that different departments have been maintaining conflicting versions of the same information. The process of reconciling those conflicts—deciding which “customer” definition is authoritative—becomes a political and organizational challenge, not just a technical one.
The root problem isn’t that systems don’t talk to each other. It’s that they don’t share a common foundation.
The Alternative: Unified Architecture from First Principles
What would it look like if your business systems started from a shared foundation instead of bolting together separate applications?
Instead of:
A CRM with its customer definition
A support platform with its customer definition
A billing system with its customer definition
Integration code to synchronize the three
You’d have:
One customer object
Different views and workflows for sales, support, and billing
No synchronization needed because there’s only one source of truth
This isn’t a theoretical concept. It’s architectural unification—the principle that instead of building separate systems and connecting them, you build from a common foundation.
Think about the smartphone convergence moment. Before the iPhone, you carried separate devices: a phone, a camera, an MP3 player, a GPS navigator, a calculator, a watch. Each device had its own battery, its own interface, its own learning curve. You managed the boundaries between them (“remember to sync your photos to your computer”).
The smartphone didn’t just integrate those devices. It unified them on a common platform. Now when you take a photo, you don’t think about “syncing the camera to the storage system.” The photo lives in one place, accessible to any app that needs it. The calendar app can geo-tag events because location and time share the same foundation.
That’s the difference between integration and unification.
Luklak’s approach uses what we call Universal Objects—a flexible data foundation that every business function shares. When you create a “customer” object, it’s the same object whether you’re viewing it in a sales pipeline, a support ticket, or a billing dashboard. Not three copies kept in sync. One object, many views.
When Blue Media, a Vietnamese marketing agency, consolidated their operations onto this kind of unified foundation, they eliminated what they describe as “the Wednesday morning ritual.” Their finance team stopped translating data between systems because there was nothing to translate. The agency’s project data, customer records, and financial information all sat on the same architectural foundation.
The time savings were immediate and obvious. But the strategic advantages took longer to recognize. When everything shares a foundation, questions that were previously complex become simple. “Which customers are most profitable?” used to require pulling data from three systems, reconciling IDs, and hoping nothing was out of sync. Now it’s a single query. “What’s the relationship between project scope changes and customer satisfaction?” used to be unanswerable because the data lived in separate universes. Now the relationship is native.
Calculating Your Organization’s Fragmentation Cost
You can measure your own fragmentation tax with surprising precision. Here’s a framework:
Step 1: Count Your Systems
List every business application your organization uses that stores operational data. Not just the big ones—include the spreadsheets teams maintain because “the official system doesn’t quite work for us.”
Most mid-market companies discover they’re using 80-150 applications.
Step 2: Identify Overlap
For each major business entity (Customer, Project, Employee, Asset, Transaction, etc.), count how many systems define it. Draw the connections where data needs to sync.
If you have three systems that define “customer,” you have three data translation problems.
Step 3: Calculate Synchronization Hours
Estimate how much time your team spends:
Manually moving data between systems (exports, imports, copy-paste)
Reconciling discrepancies when systems disagree
Fixing broken integrations
Training new people on multiple interfaces
Building reports that span multiple systems
Be honest. Most organizations underestimate this by 50-70%.
Identify one significant decision your organization made in the last quarter based on data that was 24+ hours old. Ask: “If we had real-time data, would the decision have been different? What would better timing have been worth?”
Multiply that value by how many such decisions you make annually.
Step 5: Calculate Opportunity Cost
This is harder to quantify but often larger than direct costs. List analyses, dashboards, or insights you’d want but can’t build because the data is too fragmented. What would those capabilities be worth?
Common examples:
Predictive churn models (require unified customer data across sales, support, usage)
True project profitability (require time tracking, expenses, and revenue in one view)
Resource optimization (require unified view of people, projects, and capacity)
The Path Forward
The fragmentation problem has three possible futures:
Path 1: Accept the cost. Continue with your current architecture. Accept that 30-40% of your operational capacity goes to translation work. Accept that your teams will spend Wednesday mornings moving data manually. Accept the cognitive load, the latency, the invisible work.
Many organizations implicitly choose this path. Not because they want fragmentation, but because the migration cost to fix it seems overwhelming.
Path 2: Integrate harder. Double down on integration platforms. Build more APIs. Hire more integration specialists. Automate the translation layer. Accept that you’re managing complexity rather than eliminating it, but at least reduce the manual burden.
This path helps. Automated sync is better than manual sync. But it doesn’t eliminate the architectural fragmentation—it just makes living with it more bearable.
Path 3: Rebuild on unified architecture. Start with operations that hurt the most. Consolidate them onto a shared foundation. Prove the value with one team, one function, one workflow. Then expand.
This is the hardest path in the short term. It requires rethinking how your systems are structured. It requires migration effort. It requires getting comfortable with platforms that are less mature than the enterprise behemoths.
But it’s the only path that eliminates the problem rather than managing it.
The Real Question
The question isn’t whether your organization experiences fragmentation. If you use more than a handful of business applications, you do.
The question is: What’s the fragmentation costing you?
Not in vague productivity terms, but in concrete, measurable terms. Hours spent on Wednesday morning rituals. Engineering resources consumed by integration maintenance. Decisions made on stale data. Questions that can't be answered because the data lives in separate universes.
Calculate that cost honestly. Then ask whether that’s a price worth paying.
For Blue Media, the answer was clear. For your organization, the calculation might be different. The fragmentation tax might be an acceptable cost of doing business. The integration layer might be working well enough.
But you can’t make that decision without making the cost visible.
The $450 billion context switch isn’t an abstract statistic about the economy. It’s an aggregation of millions of Wednesday morning rituals. It’s real people doing work that shouldn’t need to exist. It’s operational capacity consumed by architectural choices made years ago.